Image
Figure Caption

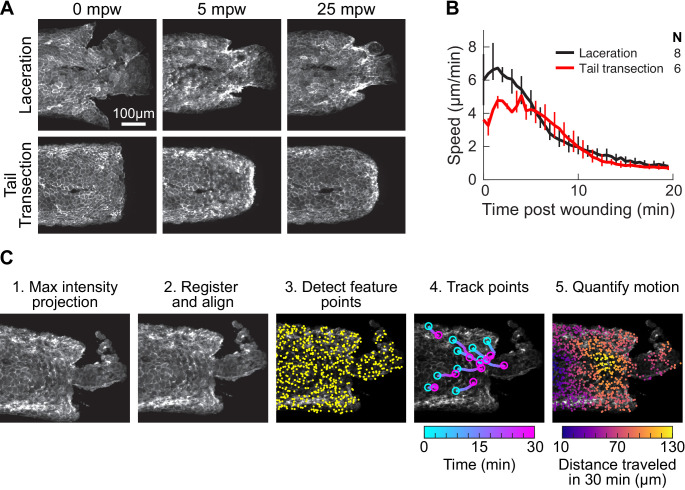
Figure 1—figure supplement 1. Comparison of laceration and tail transection wounding techniques, and overview of the procedure for tissue motion analysis.

(A) Representative images from timelapse imaging of cellular response to laceration or tail transection. 3 dpf larvae expressing LifeAct-EGFP in basal cells (TgBAC(∆Np63:Gal4); Tg(UAS:LifeAct-EGFP); Tg(hsp70:myl9-mApple)) were anesthetized with Tricaine and wounded by laceration or tail transection (see Methods) and imaged with spinning-disk confocal microscopy. Shown is Z-projections of the LifeAct signal from two representative larvae. (B) Average speed in tissue <300 µm from the wound for laceration or tail transection. Error bars are bootstrapped 95% confidence intervals of the mean. (C) Overview of procedure for tissue motion analysis. 1. Z-projection of LifeAct; myosin light-chain signal is also acquired but not shown. 2. Images of LifeAct are registered using the myosin light-chain signal to remove whole-larva drift not due to cell migration. 3. Thousands of feature points are detected throughout the tissue to use as fiducials for motion tracking from frame to frame (for clarity only 15% of the feature points detected in this frame are shown). 4. Feature points are tracked from frame to frame, reporting motion at different locations in the tissue over time. For clarity 10 randomly selected points are shown. 5. Motion is quantified at different positions in the tissue by averaging the movement of feature points across the tissue. Feature points are binned by their distance from the wound, projected along a line extending from the wound centroid anteriorly through the tail.

Acknowledgments
This image is the copyrighted work of the attributed author or publisher, and ZFIN has permission only to display this image to its users. Additional permissions should be obtained from the applicable author or publisher of the image. Full text @ Elife