
Figure 5—figure supplement 1.
- ID
- ZDB-IMAGE-201209-45
- Publication
- Segebarth et al., 2020 - On the objectivity, reliability, and validity of deep learning enabled bioimage analyses
- All Figures
- Figures for Segebarth et al., 2020
|
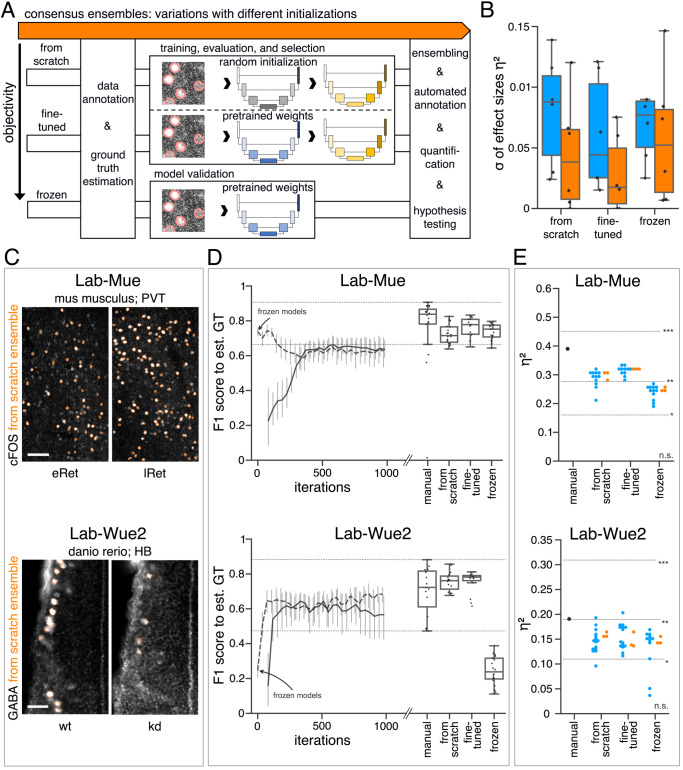
Figure 5—figure supplement 1. (A) Schematic overview depicting three initialization variants for creating consensus ensembles on new datasets. Data annotation by multiple human experts and subsequent ground truth estimation are required for all three initialization variants. In the from scratch variant, a U-Net model with random initialized weights is trained on pairs of microscopy images and estimated ground truth annotations. This variant was used to create consensus ensembles for the initial Lab-Wue1 dataset. Alternatively, the same training dataset can be used to adapt a U-Net model with pretrained weights by means of transfer-learning (fine-tuned). In both variants, models are evaluated and selected on base of a validation set after model training. In a third variant, U-Net models with pretrained weights can be evaluated directly on a validation dataset, without further training (frozen). In all three variants, consensus ensembles of the respective models are then used for bioimage analysis. (B) Overall reliability of bioimage analysis results of each variant assessed as variation per effect. In all three strategies, consensus ensembles (orange) showed lower standard deviations than consensus models (blue). The frozen results need to be considered with caution as they are based on models that did not meet the selection criterion (see Figure 5—source data 3). Npairwise comparisons = 6; Nconsensus models = 15, and Nconsensus ensembles = 3 for each variant. (C–E) Detailed comparison of the two external datasets with highest (Lab-Mue) and lowest (Lab-Wue2) similarity to Lab-Wue1. (C) Representative microscopy images. Orange: representative annotations of a lab-specific from scratch consensus ensemble. PVT: para-ventricular nucleus of thalamus, eRet: early retrieval, lRet: late retrieval, HB: hindbrain, wt: wildtype, kd: gad1b knock-down. Scale bars: Lab-Mue 100 µm and Lab-Wue2 6 µm. (D) Mean MF1 score of from scratch (solid line) and fine-tuned (dashed line) consensus models on the validation dataset over the course of training (iterations). Mean MF1 score of frozen consensus models are indicated with arrows. Box plots show the MF1 score among the annotations of human experts as reference and the mean MF1 score of selected consensus models. Two dotted horizontal lines mark the whisker ends of the MF1 score among the human expert annotations. (E) Effect sizes of all individual bioimage analyses (black: manual experts, blue: consensus models, orange: consensus ensembles). Three horizontal lines separate the significance intervals (n.s.: not significant, *: 0.05≥ p>0.01, **0.01≥ p>0.001, ***p ≤ 0.001 with Mann-Whitney-U tests). Lab-Mue: Nconsensus ensembles = 3 for all initialization variants; Nfrom scratch/fine-tuned consensus models = 12 (for each ensemble, 4/5 trained models per ensemble met the selection criterion), Nfrozen consensus models = 12 (for each ensemble, 4/4 models per ensemble did not meet the selection criterion). NeRet = 4, NlRet = 4; neRet = 12, nlRet = 11. Lab-Wue2: Nconsensus ensembles = 3 for each initialization variant; Nfrom scratch/fine-tuned consensus models = 15 (for each ensemble, 5/5 trained models per ensemble met the selection criterion), Nfrozen consensus models = 12 (for each ensemble, 4/4 models per ensemble did not meet the selection criterion). Nwt = 5, Nkd = 4, nwt = 20, nkd = 15. Source files of all statistical analyses (including Figure 5—figure supplement 2 and Figure 5—figure supplement 1) are available in Figure 5—source data 1. Information on all bioimage datasets (e.g. the number of images, image resolution, imaging techniques, etc.) are available in Figure 5—source data 2. Source files on model performance and selection are available in (Figure 5—source data 3).