Image
Figure Caption

Figure 4—source data 2. 
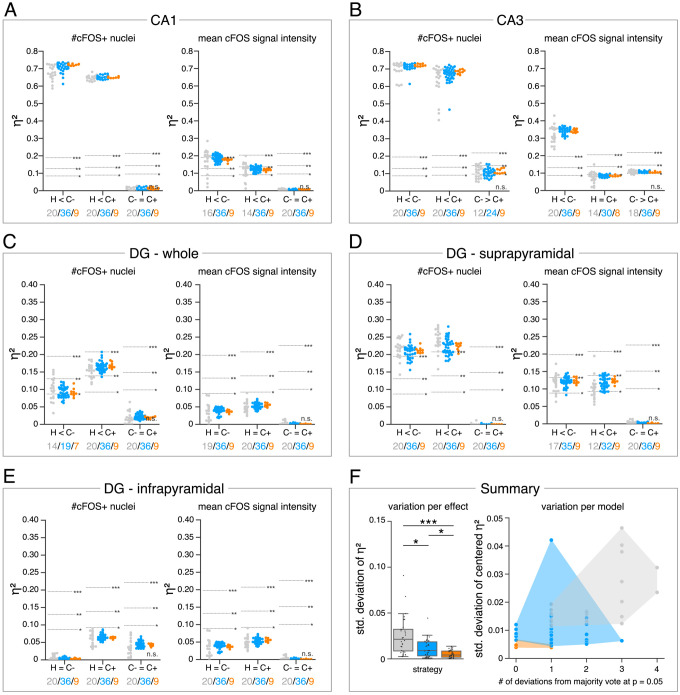
(A–E) Single data points represent the calculated effect sizes for each pairwise comparison of all individual bioimage analyses for each DL-based strategy (gray: expert models, blue: consensus models, orange: consensus ensembles) in indicated hippocampal subregions. Three horizontal lines separate four significance intervals (n.s.: not significant, *: 0.05 ≥ p>0.01, **: 0.01 ≥ p>0.001, ***: p ≤ 0.001 after Bonferroni correction for multiple comparisons). The quantity of analyses of each strategy that report the respective statistical result of the indicated pairwise comparison (effect, x-axis) at a level of p ≤ 0.05 are given below each pairwise comparison in the corresponding color coding. In total, we performed all analyses with: Nexpert models = 20, Nconsensus models = 36, Nconsensus ensembles = 9. Number of analyzed mice (N) for all analyzed subregions: NH = 7, NC- = 7, NC+ = 6. Numbers of analyzed images (n) are given for each analyzed subregion. Source files including source data and statistical data are available in Figure 4—source data 1. (A) Analyses of cFOS-positive nuclei in stratum pyramidale of CA1. nH = 36, nC- = 32, nC+ = 28. (B) Analyses of cFOS-positive nuclei in stratum pyramidale of CA3. nH = 35, nC- = 31, nC+ = 28. (C) Analyses of cFOS-positive nuclei in the granule cell layer of the whole DG. nH = 35, nC- = 31, nC+ = 27. (D) Analyses of cFOS-positive nuclei in the granule cell layer of the suprapyramidal blade of the DG. nH = 35, nC- = 31, nC+ = 27. (E) Analyses of cFOS-positive nuclei in the granule cell layer of the infrapyramidal blade of the DG. nH = 35, nC- = 31, nC+ = 27. (F) Reliability of bioimage analysis results are assessed as variation per effect (left side) and variation per model (right side). For the variation per effect, single data points represent the standard deviation of reported effect sizes (η2), calculated within each DL-based strategy for each of the 30 pairwise comparisons. Consensus ensembles show significantly lower standard (std.) deviations of η2 per pairwise comparison compared to alternative strategies (X2(2) = 26.472, p<0.001, Neffects = 30, Kruskal-Wallis ANOVA followed by pairwise Mann-Whitney tests with Bonferroni correction, *p<0.05, ***p<0.001). For the variation per model, the standard deviation of centered η2 across all pairwise comparisons was calculated for each individual model and ensemble (y-axis). In addition, the number of deviations from the congruent majority vote (at p ≤ 0.05 after Bonferroni correction for multiple comparisons) were determined for each individual model and ensemble across all pairwise comparisons (x-axis). Visualizing the interaction of both measures for each model or model ensemble individually reveals that consensus ensembles show the highest reliability of all three DL-based strategies. The statistical data for the for variation per effect is available in Figure 4—source data 2.

Acknowledgments
This image is the copyrighted work of the attributed author or publisher, and ZFIN has permission only to display this image to its users. Additional permissions should be obtained from the applicable author or publisher of the image. Full text @ Elife