Image
Figure Caption

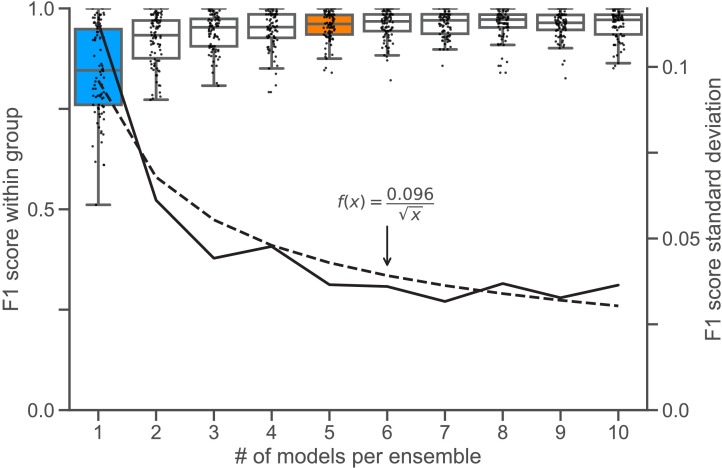
Figure 2—figure supplement 2. Ensemble size and reliability.

To determine an appropriate size for the consensus ensembles, we analyzed the homogeneity of the results through a similarity analysis. Therefore, we calculated the MF1 score at an IoU matching threshold of t=0.5 for each ensemble size i∈{1,…,10} on the holdout test set (n = 9 images). Stratified on the cross validation splits, we randomly sampled the ensembles from a collection of trained consensus models. We repeated this procedure five times to mitigate the random effect of the ensemble composition (Nensembles = 5 for each i). The blue box (i=1) depicts the variability between different consensus models. The orange box (i=4) shows the variability of the finally chosen size for the consensus ensembles, as no substantial reduction in variation can be observed for larger i. In addition, i=4 corresponds to the number of cross validation splits (k=4), meaning that the ensembles have seen the entire training set. The black line denotes the standard deviation of MF1 score, which is scaled at the right y-Axis. The dashed black line denotes the best fitting function of type ƒ(x)=(a /√x) with a=0.096 for the standard deviation.

Acknowledgments
This image is the copyrighted work of the attributed author or publisher, and ZFIN has permission only to display this image to its users. Additional permissions should be obtained from the applicable author or publisher of the image. Full text @ Elife