
Fig. 4
- ID
- ZDB-IMAGE-201003-203
- Publication
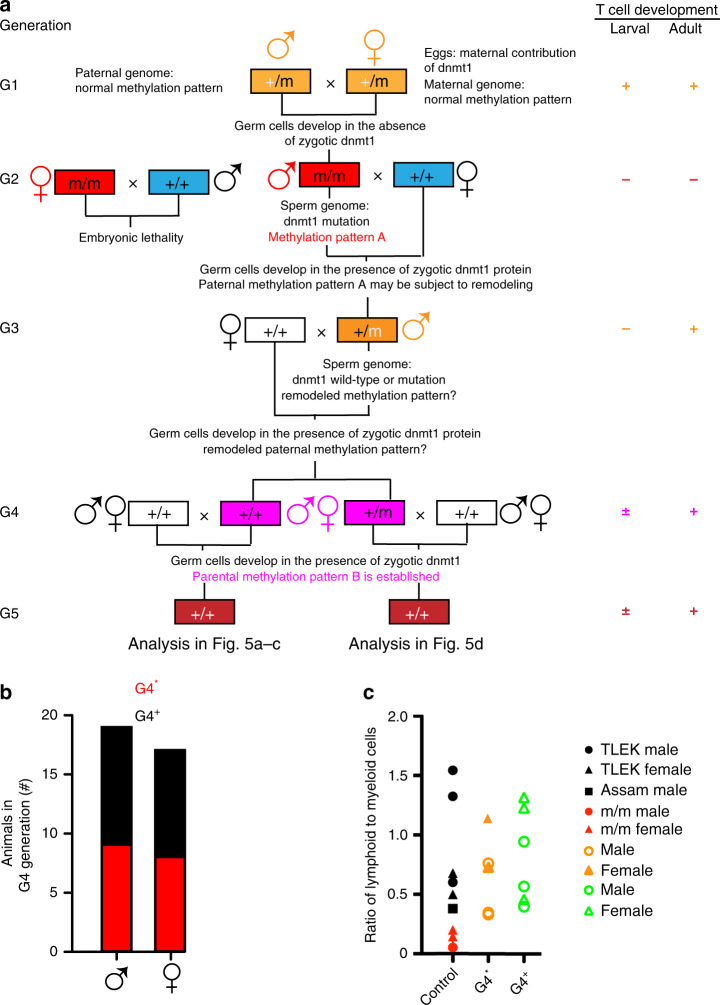
- Iwanami et al., 2020 - Transgenerational inheritance of impaired larval T cell development in zebrafish
- All Figures
- Figures for Iwanami et al., 2020
|
Fig. 4