
IMAGE
Figure 7
- ID
- ZDB-IMAGE-201003-171
- Genes
- Publication
- Vishnolia et al., 2020 - Studies in Zebrafish Demonstrate That CNNM2 and NT5C2 Are Most Likely the Causal Genes at the Blood Pressure-Associated Locus on Human Chromosome 10q24.32
- All Figures
- Figures for Vishnolia et al., 2020
Image
|
Figure Caption
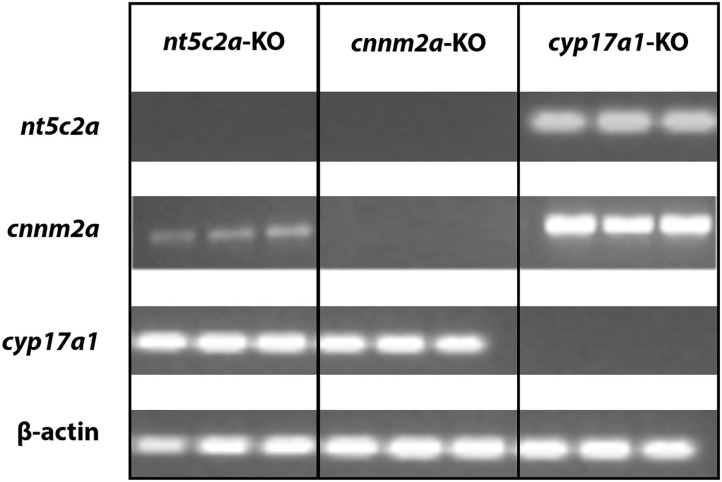
Figure 7
Co-regulation of cnnm2 and nt5c2 genes. Agarose gel micrograph representing bands of DNA samples collected from cnnm2a, cyp17a1, and nt5c2a mutants. Each set of samples were investigated for expression of other genes along with house-keeping genes.
Figure Data
Acknowledgments
This image is the copyrighted work of the attributed author or publisher, and
ZFIN has permission only to display this image to its users.
Additional permissions should be obtained from the applicable author or publisher of the image.
Full text @ Front Cardiovasc Med