
Figure 1—figure supplement 1.
- ID
- ZDB-IMAGE-201003-158
- Publication
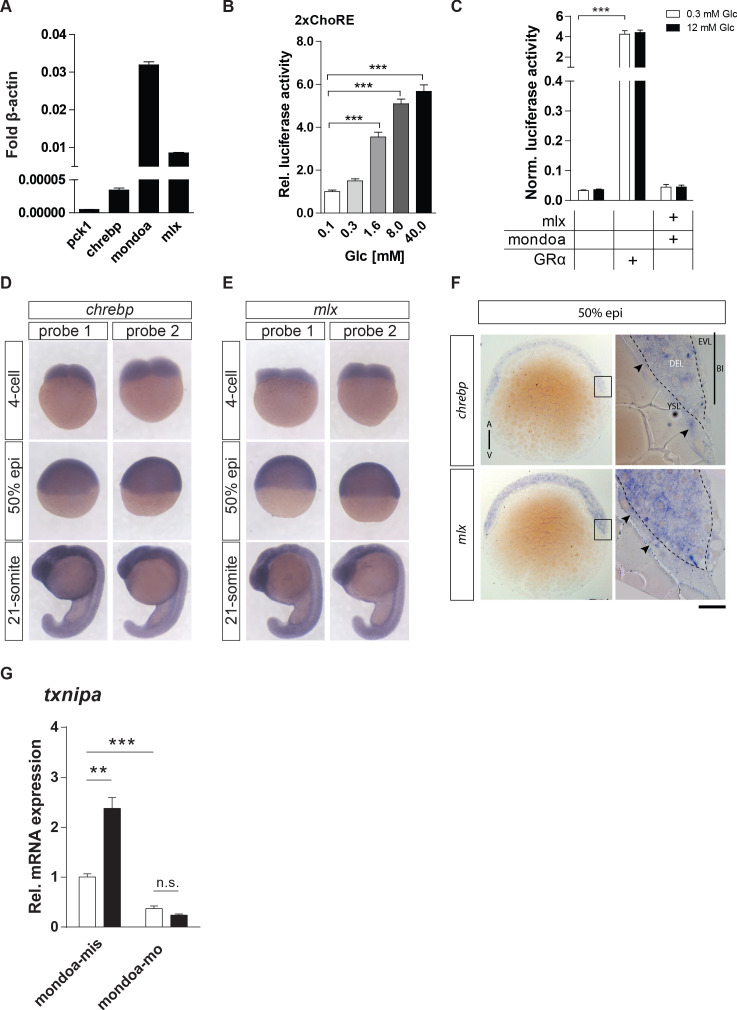
- Weger et al., 2020 - MondoA regulates gene expression in cholesterol biosynthesis-associated pathways required for zebrafish epiboly
- All Figures
- Figures for Weger et al., 2020
|
Figure 1—figure supplement 1.
(