
Fig. 6
- ID
- ZDB-IMAGE-200925-11
- Genes
- Publication
- Allen et al., 2020 - Fibrodysplasia ossificans progressiva mutant ACVR1 signals by multiple modalities in the developing zebrafish
- All Figures
- Figures for Allen et al., 2020
|
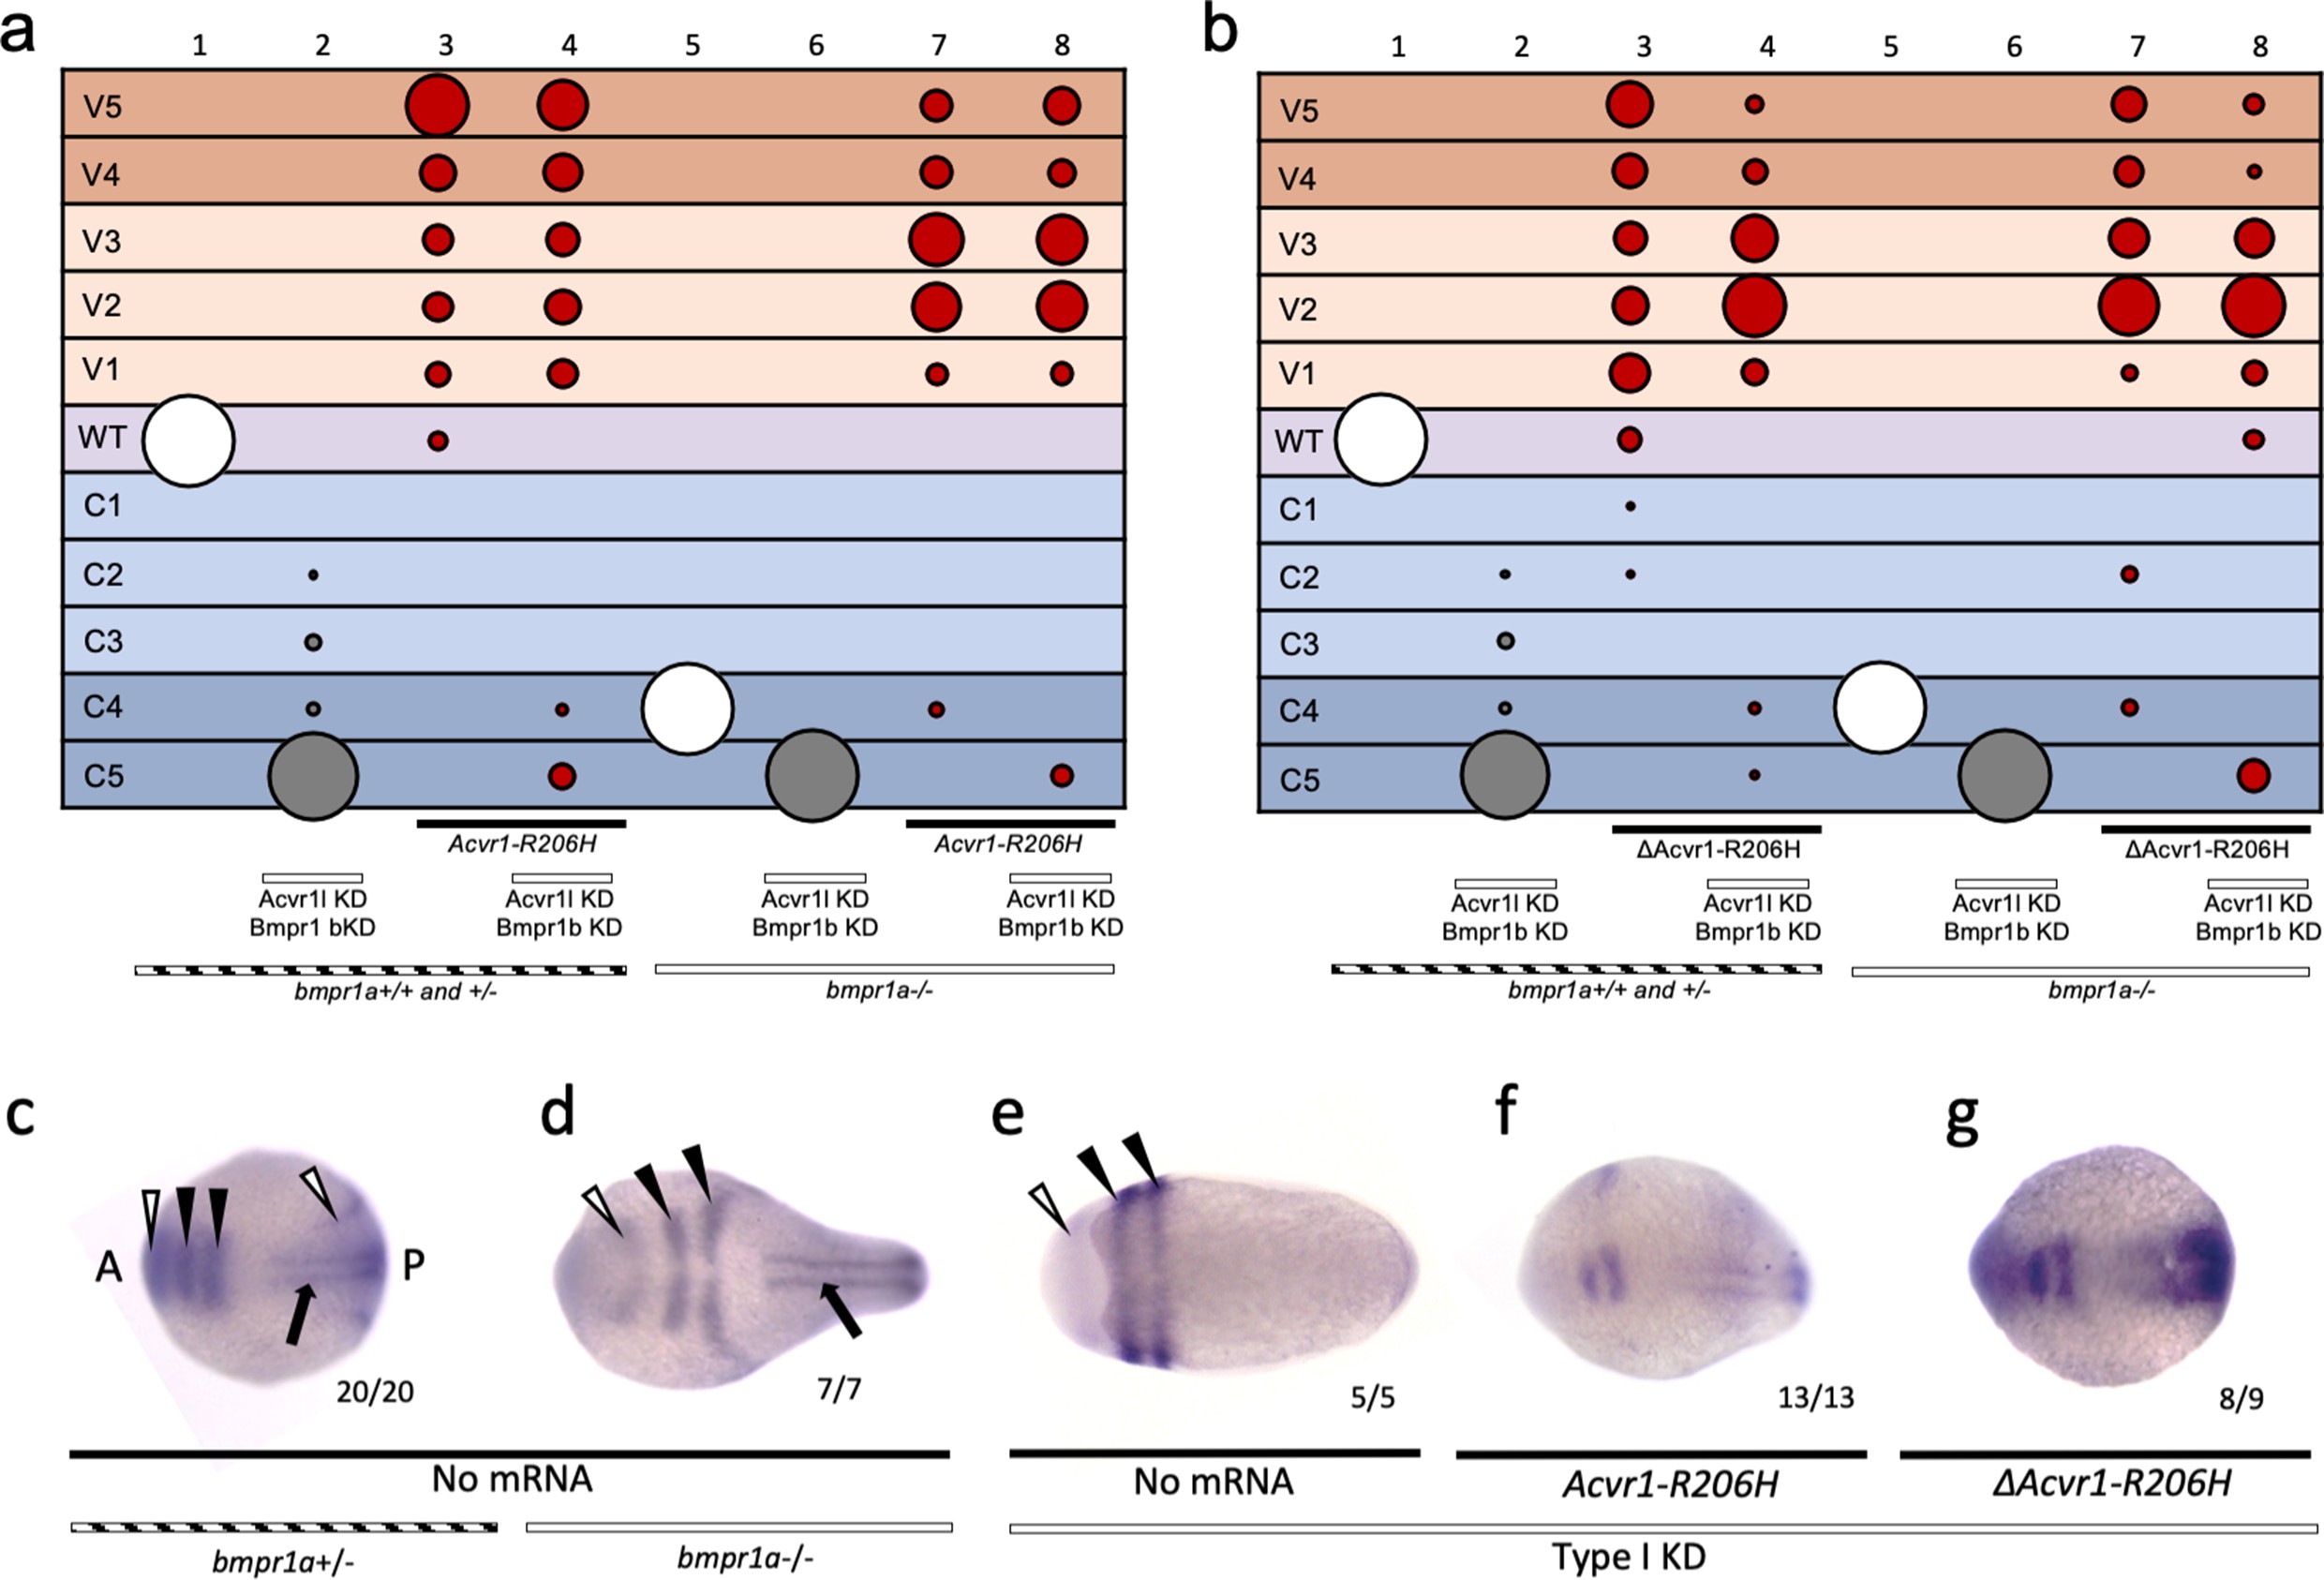
Fig. 6 (a–b) Injected bmpr1a+/- or -/- 12 to 30 hpf embryo phenotypes with bmpr1b KD, acvr1 KD with or without Acvr1-R206H or ΔAcvr1-R206H mRNA. Two pooled experiments. (a) Acvr1-R206H injected embryos. Columns: 1, N = 150; 2, N = 80; 3, N = 98; 4, N = 89; 5, N = 76; 6, N = 36; 7, N = 31; 8, N = 30. (b) ΔAcvr1-R206H injected embryos. Columns: 1, N = 150; 2, N = 80; 3, N = 92; 4, N = 127; 5, N = 76; 6, N = 36; 7, N = 26; 8, N = 37. (c–i) Representative dorsal view of pax2.1 (white arrowheads: anteriorly in the midbrain-hindbrain boundary and posteriorly in the pronephric mesoderm), krox20 (black arrowheads; rhombomeres 3 and 5), and myod (black arrow; paraxial mesoderm) expression in 5–9 somite stage bmpr1a+/-or -/- embryos with bmpr1b KD, acvr1 KD with or without Acvr1-R206H or ΔAcvr1-R206H. Two independent experiments. Embryos are oriented with the anterior (A) side left and the posterior (P) side right. Number of embryos that showed expression patterns similar to the representative embryos out of the total number of embryos analyzed is shown. (c) bmpr1a+/- embryo (d) bmpr1a-/- embryo (e) bmpr1a-/-embryo with acvr1l and bmpr1b KD (Type I KD embryo) (f) Type I KD embryo injected with Acvr1-R206H mRNA. (g) Type I KD embryo injected with ΔAcvr1-R206H mRNA.