IMAGE

Figure 9

ID
ZDB-IMAGE-200829-20
Source
Figures for Hudson et al., 2020
Image
Figure Caption

Figure 9

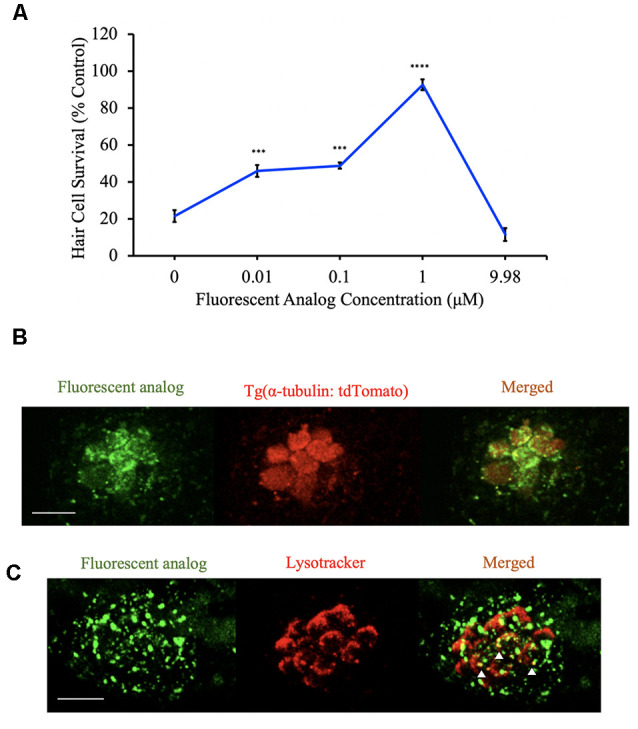
Berbamine analogs enter hair cells. (A) The dose-response curve for the fluorescent analog (BA-17) demonstrates significant protection from 200 μM neomycin. Hair cells were assessed via DASPEI. Data are normalized to controls. One-way ANOVA, F(4,49) = 50.22, p < 0.0001. N = 10–12, ****p < 0.0001, ***p < 0.001, bars are ± SEM. (B)Tg(α-tubulin: tdTomato) zebrafish were pretreated with BA-17 for 1 h before imaging on a confocal microscope. Fluorescent analog (green) is present in hair cells (red). Scale bar = 10 μm. (C) AB zebrafish were pretreated with BA-17 for 1 h followed by a 3-min exposure to 50 nM LysoTracker before confocal imaging. Fluorescent analog (green) does overlap with lysosomes (red) in some areas (white arrowheads). Scale bars in (B,C) = 10 μm.

Acknowledgments
This image is the copyrighted work of the attributed author or publisher, and ZFIN has permission only to display this image to its users. Additional permissions should be obtained from the applicable author or publisher of the image. Full text @ Front. Cell. Neurosci.