IMAGE

Figure 4

ID
ZDB-IMAGE-200817-38
Source
Figures for Zhou et al., 2020
Image
Figure Caption

Figure 4

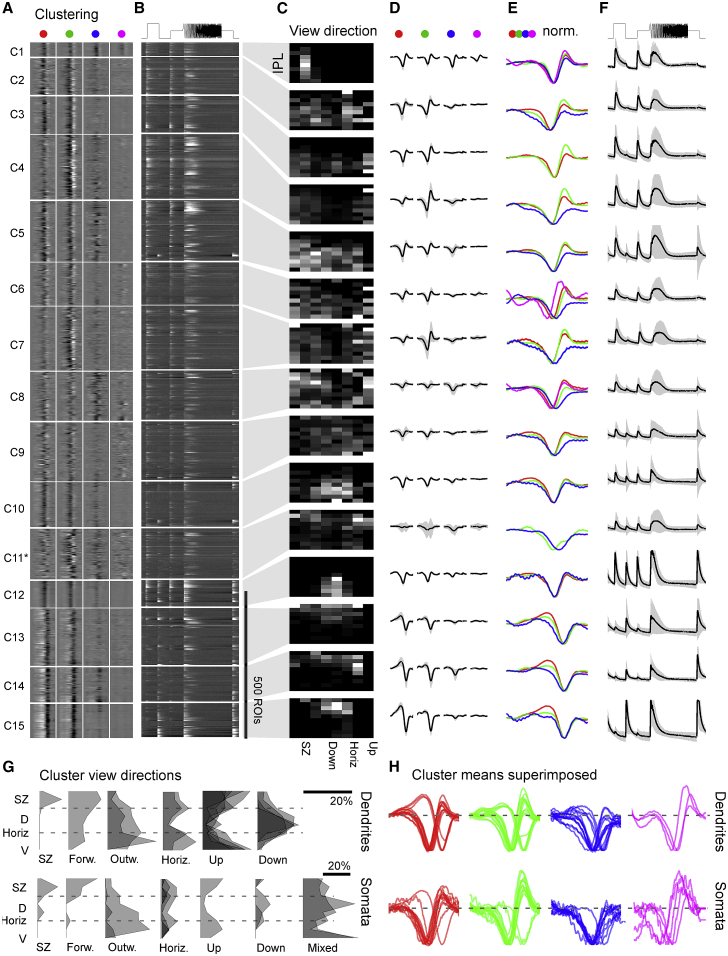
Functional Clustering of Dendritic ROIs

(A–F) Dendritic ROIs from across the entire eye were clustered based on their four spectral kernels (STAR Methods) to yield a total of n = 15 functional clusters that comprised a minimum of 10 ROIs. Shown are heatmaps of red, green, blue, and UV kernels (A, from left to right, respectively) and associated mean chirp response (B), with each entry showing a single ROI, followed by each cluster’s Eye-IPL projection (C), each mean kernel (D), max-scaled kernels superimposed (E), and the mean chirp response (F). Error shadings in SD are shown. For clarity, low-amplitude mean kernels were omitted from column (E). Note that C11 comprised a mixture of responses and may comprise a variety of low-n functional RGC types. Grayscale color maps (A–C) were linearly equalized by hand to maximize subjective discriminability of the full response range across the population of all recordings in a dataset. Lighter grays indicate higher activity/kernel amplitudes. For corresponding data on somata, see Figure S3.

(G) Summary of cluster distributions across the eye, irrespective of IPL depths, for dendritic (top) and somatic (bottom) clusters, scaled by their relative abundance (in %; see scale bars). Eye-distribution profiles were manually allocated to one of the following groups based on which part of visual space is mainly surveyed: SZ (dendritic C1; somatic C2); forward (dendritic C5; somatic C3); outward (dendritic C3,9; somatic C9,11); horizon (dendritic C2,11; somatic C1,4,10); up (dendritic C4–8; somatic C7); and down (dendritic C10,12–15; somatic C12,13). Two large clusters (somatic C5,8) did not obviously fit to any of these categories and were instead grouped separately as “mixed.” It is possible that these clusters comprise several smaller groups of functional RGCs with distinct eye-wide distributions.

(H) As (E) for both dendritic (top) and somatic (bottom) data, but with all spectral kernels in each waveband superimposed. Note kinetic similarities across most red and green kernels and near complete absence of positive deflections in blue kernels.

Acknowledgments
This image is the copyrighted work of the attributed author or publisher, and ZFIN has permission only to display this image to its users. Additional permissions should be obtained from the applicable author or publisher of the image. Full text @ Curr. Biol.