IMAGE

Figure 10

ID
ZDB-IMAGE-200725-29
Genes
Antibodies
Source
Figures for Toms et al., 2020
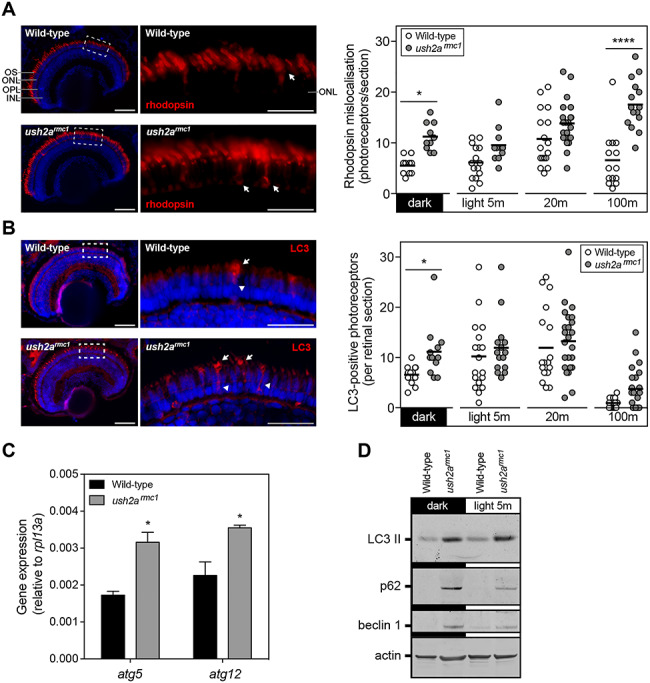
Image
Figure Caption

Figure 10

Rhodopsin mislocalization and elevated autophagy in ush2armc1 larvae. (A) Rhodopsin (red) was predominantly detected in the outer segment of wt and ush2armc1 larvae at 6 dpf. The inner segments occasionally revealed rhodopsin immunofluorescence, indicative of mislocalized rhodopsin transport vesicles (arrow). Representative images of dark-adapted larvae are shown for both genotypes. Quantification of the number of photoreceptors with distinct rhodopsin immunofluorescence in the inner segment revealed increased rhodopsin mislocalization in ush2armc1 mutants. Two-way ANOVA revealed a significant interaction between the moment of sampling and the genotype of the larvae (P = 0.0019), a significant difference in rhodopsin mislocalization between wt and ush2armc1 mutants (P < 0.0001) and difference in rhodopsin mislocalization depending on moment of sampling (P < 0.0001). Bonferroni’s post-test was used to reveal differences between groups (*P < 0.05; ****P < 0.0001). (B) LC3 immunoreactivity, a marker for autophagosome vesicles, could be observed in the periciliary region (arrow) and inner segment (arrowhead) of a subset of photoreceptors. Representative images of dark-adapted larvae, are shown for both genotypes. Quantification of the number of photoreceptors with distinct LC3 immunofluorescence in the inner segment revealed increased presence of autophagosomes in ush2armc1 mutants. Two-way ANOVA revealed no significant interaction between the moment of sampling and the genotype of the larvae, a significant difference in LC3-positive photoreceptors between wt and ush2armc1 mutants (P = 0.0078) and difference in LC3-positive photoreceptors depending on moment of sampling (P < 0.0001). Bonferroni’s post-test was used to reveal differences between groups (*P < 0.05). (C) Quantitative RT-PCR analysis of autophagy associated genes atg5 and atg12 in wt and ush2armc1 larvae. Two pools of 10 larvae were used per genotype (*P < 0.05, unpaired t-test). (D) Western blot analysis of pooled larvae, using antibodies directed at several markers of autophagy, revealed differences in expression of these markers between wt and ush2armc1 mutants. Anti-actin was used as a loading control. OS, outer segments; ONL, outer nuclear layer; OPL, outer plexiform layer; INL, inner nuclear layer. Scale bars = 25 μm.

Figure Data
Acknowledgments
This image is the copyrighted work of the attributed author or publisher, and ZFIN has permission only to display this image to its users. Additional permissions should be obtained from the applicable author or publisher of the image. Full text @ Hum. Mol. Genet.