
|
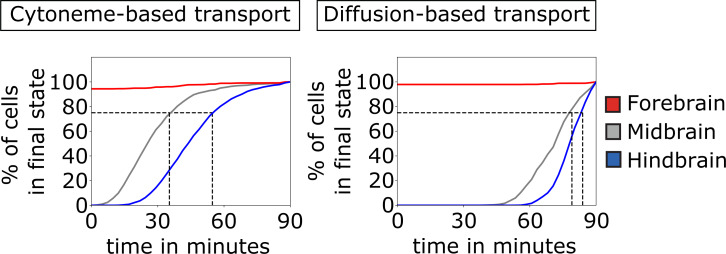
Fig 6
Comparison of the establishment of the three brain primordia based on cytoneme and diffusion-based transport. The percentage of cells that reach sufficient morphogen concentration to adopt their final cell fate (which is in this case determined by thresholding at tTRS = 90 min so that the tissue is split into thirds by cell numbers) is plotted over time. This is shown for forebrain (red solid line), midbrain (gray solid line), and hindbrain (blue solid line). The gray dashed lines mark the points in time where 75% of the midbrain and hindbrain cells adopted their final fate, respectively. After about 45 min, the majority of cells (75%) acquire their final fate if the ligand is transported on cytonemes. A diffusion-based distribution requires considerably longer time (about 80 min) to determine the cellular fate in the target tissue. The values are averaged over 100 simulations.