
Figure 5.
- ID
- ZDB-IMAGE-200718-55
- Genes
- Publication
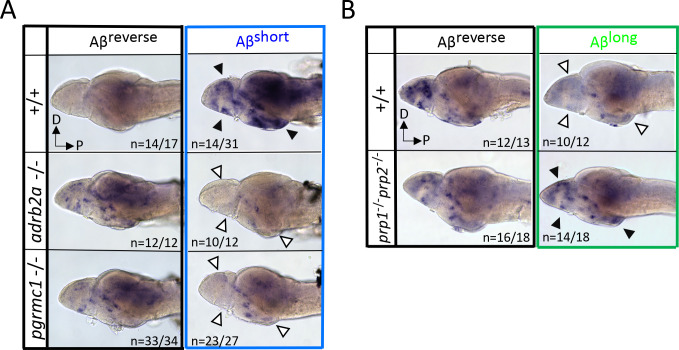
- Özcan et al., 2020 - Sleep is bi-directionally modified by amyloid beta oligomers
- All Figures
- Figures for Özcan et al., 2020
|
Figure 5.
(