
|
FIGURE 3
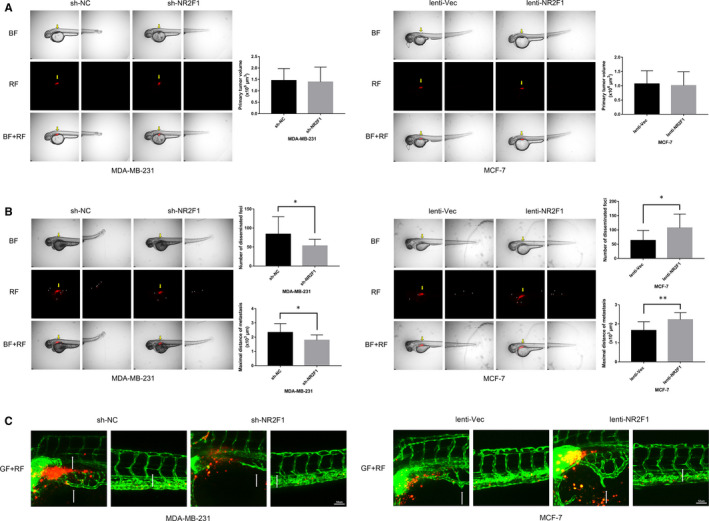
lncRNA NR2F1‐AS1 promotes breast cancer angiogenesis in zebrafish model. A, 0 h after microinjection of transfected MDA‐MB‐231 and MCF‐7 cells into the perivitelline space of embryos at 48 h post‐fertilization (representative image). B, Metastasis of the transfected breast cancer cells in zebrafish at 24 h post‐injection (representative image, for MDA‐MB‐231, n = 13/group, for MCF‐7, n = 14/group). C, Representative image of neo‐vascularization around breast cancer cells in zebrafish at 24 h post‐injection. Yellow arrows direct to the primary location of breast cancer cells. Small arrowheads direct to disseminated and metastatic tumour foci. White arrows direct to new formed tumour vascularization. BF, bright field; GF, green fluorescence; RF, red fluorescence. *