IMAGE

Fig. 4

ID
ZDB-IMAGE-200711-16
Source
Figures for Castanon et al., 2020
Image
Figure Caption

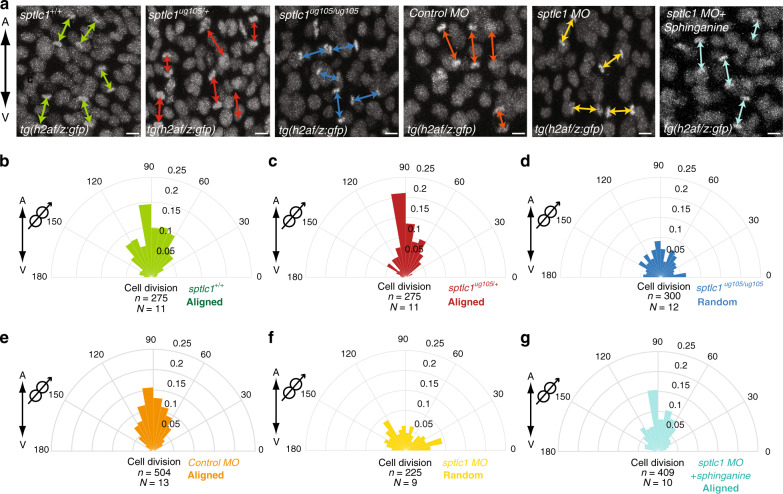
Fig. 4 Sphingolipids regulate oriented divisions of epiblast cells.

ag Orientation of division of dorsal epiblast cells with respect to the A/V embryonic axis determined by using H2A.F/Z:GFP transgenic line to monitor chromosome separation during anaphase. a Representative confocal images of dorsal epiblast cells expressing H2A-GFP in sptlc1+/+, sptlc1ug105/+ and sptlc1ug105/ug105 embryos and in control, sptlc1 morphants and sptlc1 morphant embryos treated with sphinganine (from left to right) from at least nine independent experiments. Division axes are marked by arrows. Animal pole is up. Scale bars: 10 µm. bg Polar graphs showing the frequency distribution of the angle between the division axis and the A/V embryonic axis from (a) in sptlc1+/+, (b) sptlc1ug105/+, (c) sptlc1ug105/ug105, (d) control morphants, (e) sptlc1 morphants, (f) and sptlc1 morphants treated with sphinganine (g). n (number of cell divisions analyzed) over N (number of embryos). Divisions are aligned along the A/V axis in sptlc1+/+, sptlc1ug105/+ and in control morphant embryos, but randomized in sptlc1ug105/ug105 embryos and sptlc1 morphants. Randomization of division in sptlc1 morphants is rescued by injection of 0.5 nl of 0.25 μM sphinganine. In (bg), χ2 test was used (see Supplementary Table 1). Cartoons at the corner of polar graphs in this report indicate the parameter measured. Source data are provided as a Source Data file.

Figure Data
Acknowledgments
This image is the copyrighted work of the attributed author or publisher, and ZFIN has permission only to display this image to its users. Additional permissions should be obtained from the applicable author or publisher of the image. Full text @ Nat. Commun.