
Fig. 5
- ID
- ZDB-IMAGE-200617-4
- Genes
- Publication
- Ahmed Alfar et al., 2017 - Distinct Levels of Reactive Oxygen Species Coordinate Metabolic Activity with Beta-cell Mass Plasticity
- All Figures
- Figures for Ahmed Alfar et al., 2017
|
Fig. 5
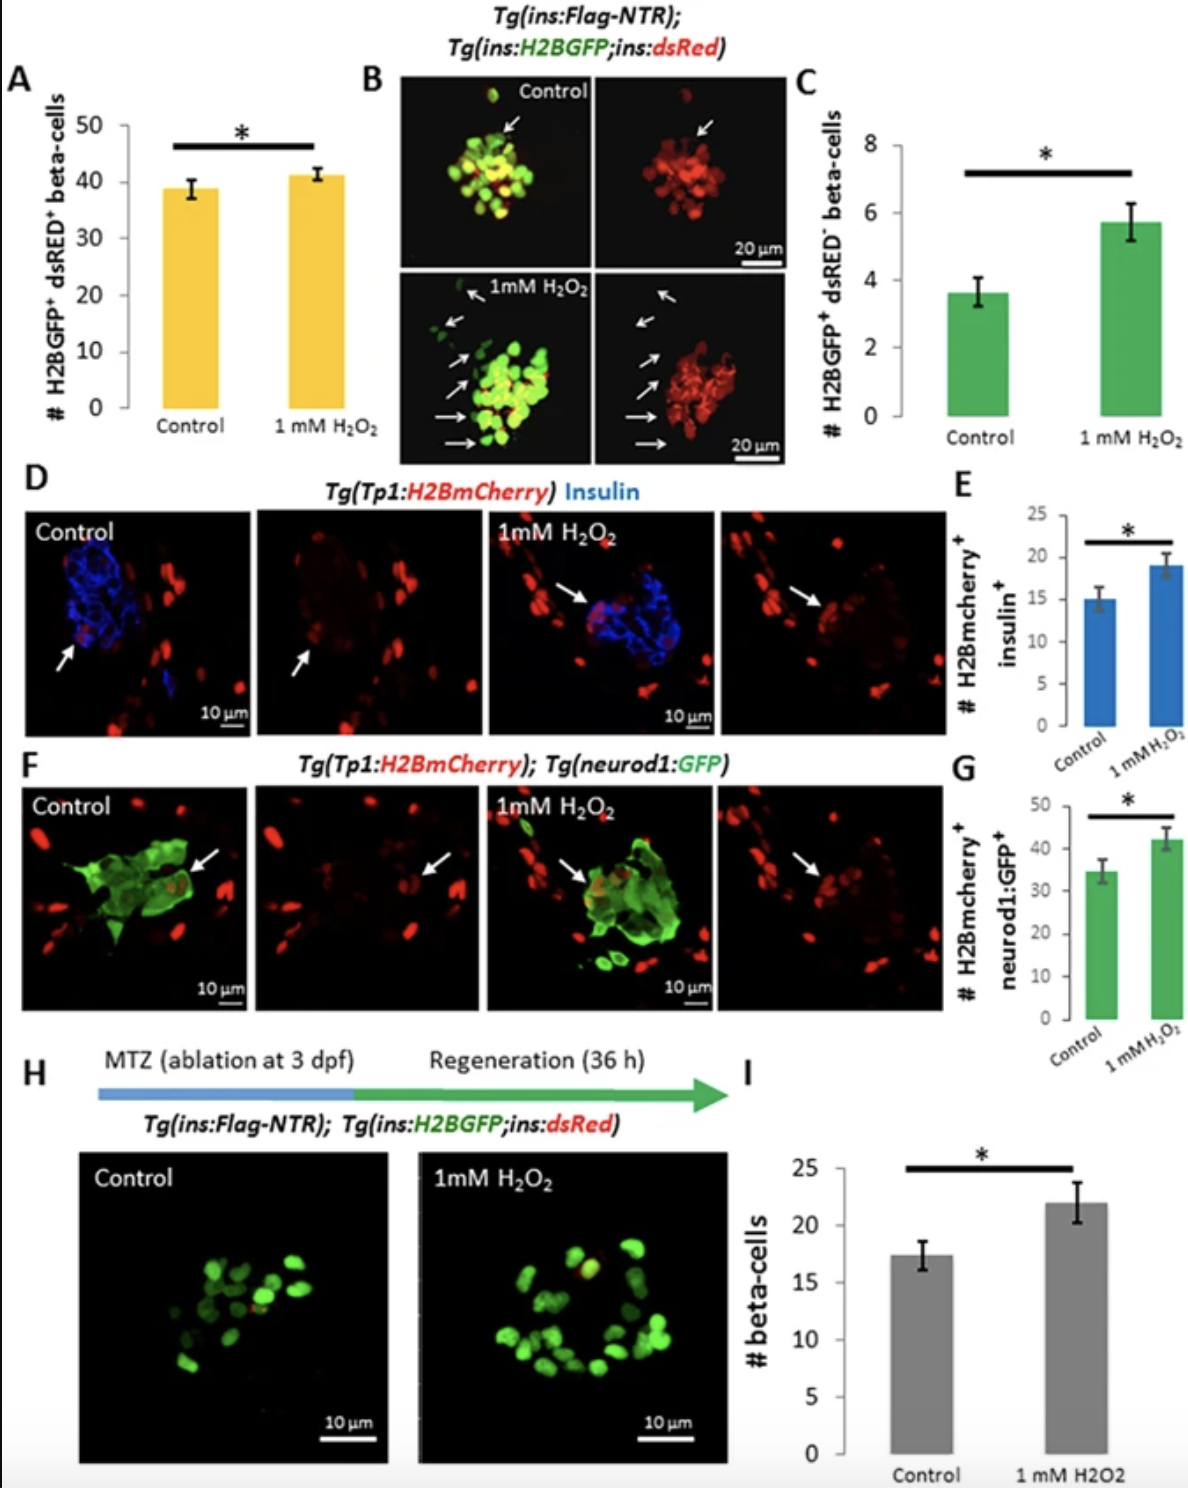
High levels of H2O2 promote new beta-cell neogenesis and regeneration. (A) Quantification of the average number of beta-cells marked with H2B-GFP in controls (n = 22) and larvae treated with 1 mM H2O2 from 3 to 4 dpf (n = 23). The larvae treated with 1 mM H2O2 exhibit an increase in the number of beta-cells compared to controls (p = 0,04). (B) Confocal projections of the principal islet of 4 dpf WT and Tg(ins:H2B-GFP; ins:dsRED) larvae treated with vehicle or 1 mM H2O2 from 3 to 4 dpf. Arrowheads point to H2B-GFP+ dsRED− cells. (C) Quantification of the number of H2B-GFP+ and dsRED− cells in controls and H2O2-treated larvae. Beta-cells that are H2B-GFP+ but dsRED− represent recently-formed cells due to the slower maturation of dsRED compared to GFP. H2O2-treatment increased the number H2B-GFP+ and dsRED− beta-cells compared to controls (p = 0,004), indicating an increase in new beta-cell formation. Error bars = SEM. (D) Confocal sections of primary islets from Tg(Tp1:H2BmCherry) larvae stained for insulin (blue). Tg(Tp1:H2BmCherry) drives expression of a fluorescent protein with long half-life (H2BmCherry) in the Notch responsive cells (NRCs) in the pancreas. Beta-cells that differentiate from NRCs can retain H2BmCherry-flurescence due to perdurance. The larvae were treated with vehicle or 1 mM H2O2 from 3 to 4 dpf. The arrows indicate Tp1:H2BmCherry+ and insulin+ cells in the periphery of the primary islets in controls and H2O2-treated larvae. See Figure S6 for higher resolution images. (E) Quantification of the average number of Tp1:H2BmCherry+ and insulin+ cells in the principal islets of controls (n = 21) and H2O2-treated larvae (n = 19), showing an increase following the H2O2-treatement (p = 0,049). (F) Confocal sections of primary islets from Tg(Tp1:H2BmCherry); Tg(neurod1-GFP) larvae. The arrows indicate Tp1:H2BmCherry+ and GFP+ cells in the periphery of the primary islets in controls and H2O2-treated larvae. See Figure S7 for higher resolution images. (G) Quantification of the average number of Tp1:H2BmCherry+ and GFP+ cells in the principal islets of controls (n = 21) and H2O2-treated larvae (n = 19), showing an increase following the H2O2-treatement (p = 0,046). (H) Confocal projections of Tg(ins:FLAG-NTR); Tg(ins:H2B-GFP;ins:dsRED) larvae. Beta-cells were ablated by incubating larvae in MTZ at 3 dpf. Subsequently, the larvae were treated with vehicle or 1 mM H2O2. (I) Quantification of the average number of beta-cells in controls (n = 24) and H2O2-treated larvae (n = 22). H2O2-treatment significantly increased the number of regenerating beta-cells (p = 0,03). Note that a majority of the regenerated beta-cells are H2B-GFP+ and dsRED−. Error bars = SEM.