
Figure 6
- ID
- ZDB-IMAGE-200612-25
- Publication
- Hartmann et al., 2020 - An image-based data-driven analysis of cellular architecture in a developing tissue
- All Figures
- Figures for Hartmann et al., 2020
|
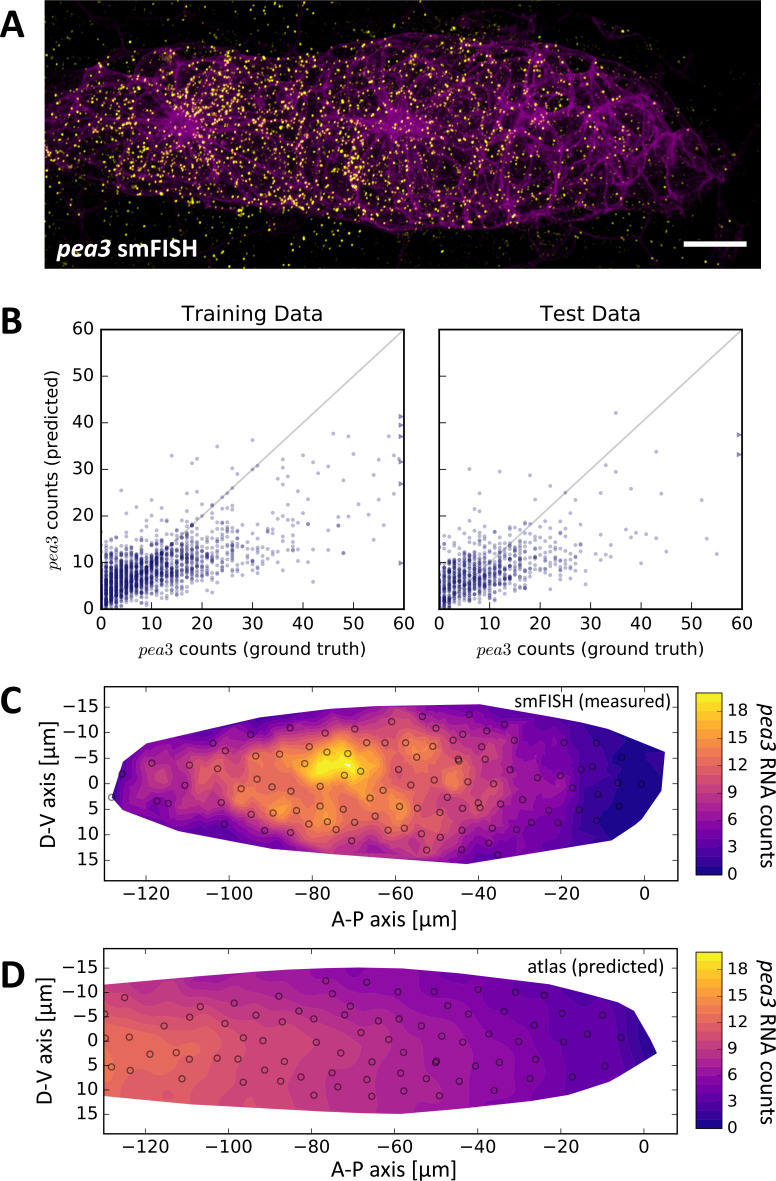
Figure 6 (A) Maximum z-projection of a two-color stack of pea3 smFISH (yellow) and the lyn-EGFP membrane marker (magenta). Scale bar: 10 µm. (B) Results of SVR regression on pea3 spot counts using TFOR and CFOR shape features as well as cell centroid coordinates of registered primordia as input. Each blue dot is a cell, the diagonal gray line reflects perfect prediction and blue arrows at the border point to outliers with very high spot counts. On training data, the regressor's explained variance ratio is 0.462 ± 0.011, on previously unseen test data it achieves 0.382 ± 0.019. (C–D) Consensus tissue maps of pea3 expression generated directly from the pea3 smFISH dataset (C) or from the full atlas dataset based on SVR predictions of spot counts (D). Note that the prediction for the entire atlas preserves the most prominent pattern – the front-rear gradient across the tissue – but does not capture the noisy heterogeneity among follower cells observed in direct measurements.