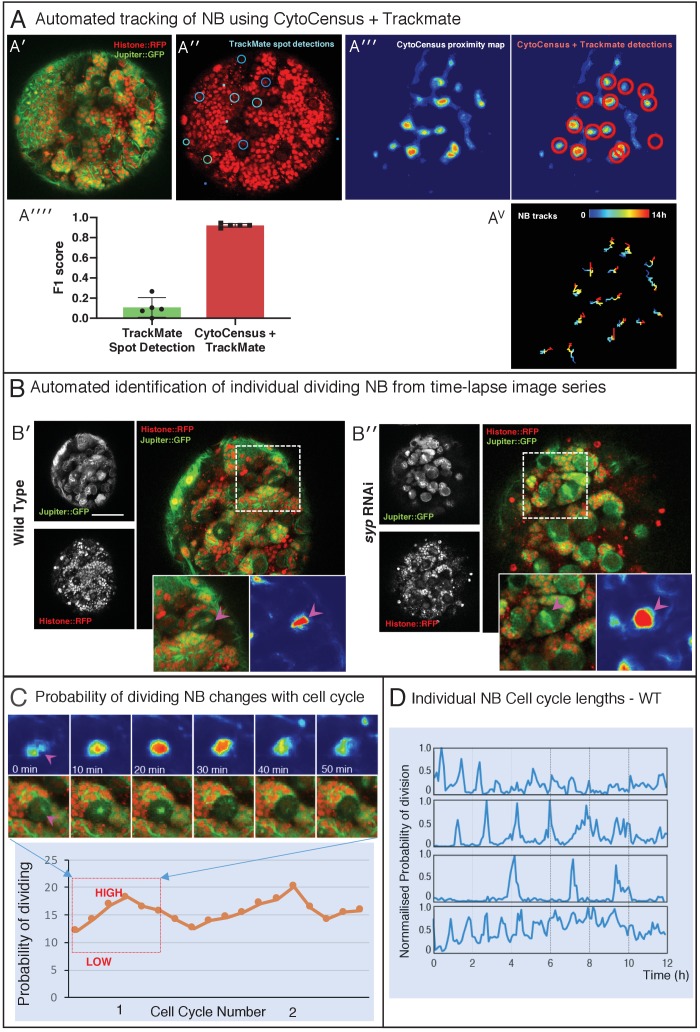
Related to Figure 5. (A) Tracking of NB with TrackMate and CytoCensus (A′-A′′) Raw image, and histone-based detections of NB (cyan circles) from TrackMate (A′′′) CytoCensus NB proximity map, and corresponding TrackMate detections (red circles) (A′′′′) Graph of F1-score of raw TrackMate detections and CytoCensus proximity map with TrackMate detections (AV) NB tracks that span the whole 14 hmovie from CytoCensus + TrackMate (B) Automated identification of individual dividing NB for time-lapse series using the probability density map output of CytoCensus. (B′-B′′) Show WT and syp RNAi brains, with inset highlighting an individual dividing NB (marked with anti-Ase, anti-Dpn and DAPI) and their corresponding proximity maps. Scale bar is 50 µm. (C) Change in proximity score (probability of division) plotted over time for an individual WT NB undergoing division: upper panels are the confocal images and corresponding proximity maps; lower panel is a plot of probability covering two cell cycles, the region corresponding to the images above is highlighted. (D) Series of plots showing different NB over time, and the changes in the probability of dividing (B) as they progress through the cell cycle.
Acknowledgments
This image is the copyrighted work of the attributed author or publisher, and
ZFIN has permission only to display this image to its users.
Additional permissions should be obtained from the applicable author or publisher of the image.
Full text @ Elife
Your Input Welcome
Thank you for submitting comments. Your input has been emailed to ZFIN curators who may contact you if
additional information is required.
Oops. Something went wrong. Please try again later.