
|
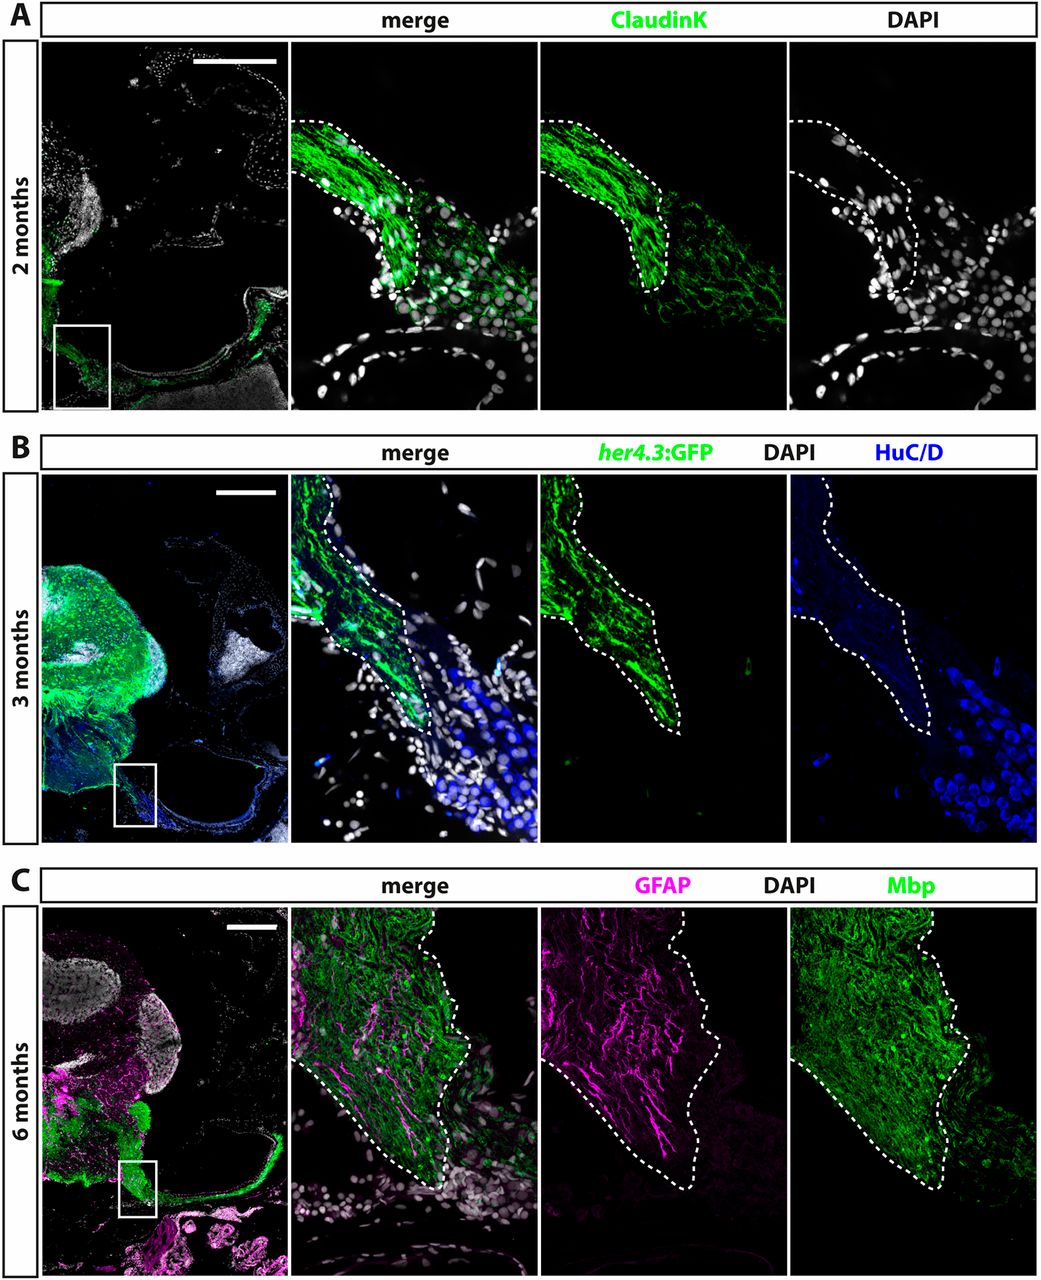
Fig. 7 Expression of glia markers and differences in myelination patterns mark the PCTZ in the SAG. (A) Antibody staining against Claudin K showing the PCTZ (dashed line) as a sharp boundary, visible as a change in the myelination pattern in the SAG in 2-month-old fish. (B) Antibody staining against the glia marker her4.3:GFP and HuC/D in 3-month-old zebrafish reveals expression of her4.3:GFP in the medial part of the SAG, similar to the myelination expression pattern (dashed line); HuC/D-positive neurons reside lateral from the PCTZ. (C) Co-staining of the glia marker GFAP and the myelination marker Mbp shows a similar expression pattern as reported in A and B, with the PCTZ marked by a change in the myelination pattern and medial expression of the glia marker. Panels on right show magnification of boxed areas in left panels. Scale bars: 200 µm. Cross-sections show dorsal to the top and lateral to the right.