IMAGE

Figure 4

ID
ZDB-IMAGE-200421-30
Source
Figures for S Alqahtani et al., 2020
Image
Figure Caption

Figure 4

HepG2 cell death after treatment with compounds CM1 and CM2. Cells were exposed to the IC50 for 48 h, and cells undergoing either apoptosis or necrosis were assessed using co-staining with Annexin-V/FITC-PI dyes. (
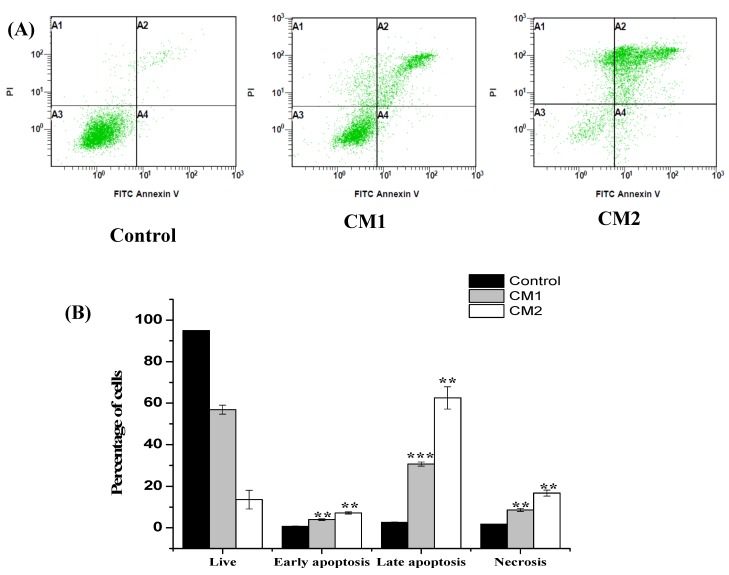
A) Representative scatter plots of PI (y-axis) vs. FITC-Annexin V (x-axis); live cells (A3) were negative for both dyes, (A4) early apoptotic cells were positive for only FITC -Annexin V, (A2) late apoptotic cells were stained with both dyes and(A1) Necrotic cells were stained with PI only. (B) Percentage of viable, early apoptotic, and late apoptotic + necrotic cells. Data are presented as the means ± SD of the triplicate experiments. ** p < 0.05 and *** p < 0.01 vs. control.

Acknowledgments
This image is the copyrighted work of the attributed author or publisher, and ZFIN has permission only to display this image to its users. Additional permissions should be obtained from the applicable author or publisher of the image. Full text @ Molecules