IMAGE

Figure 7

ID
ZDB-IMAGE-200410-14
Source
Figures for He et al., 2020
Image
Figure Caption

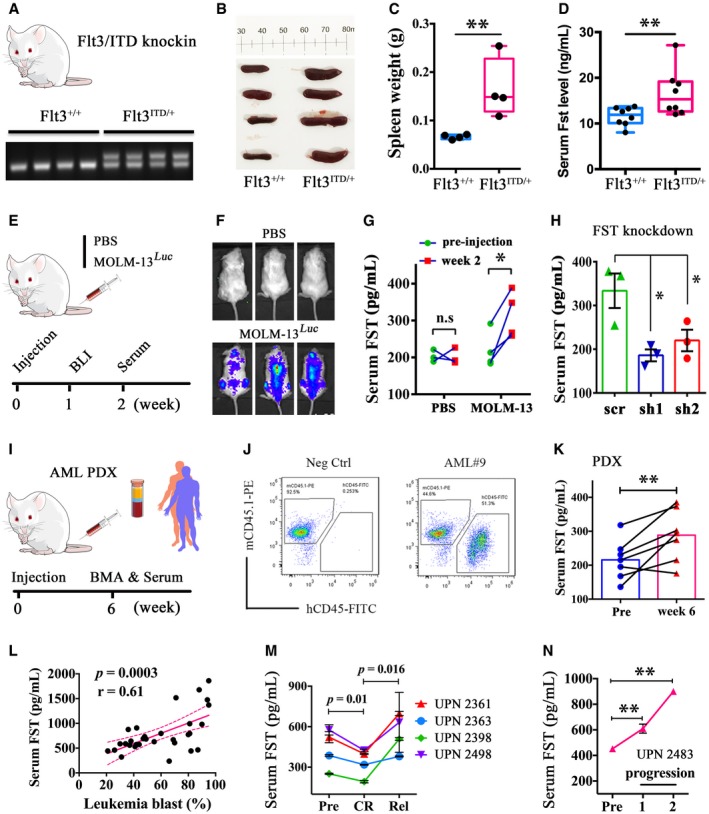
Figure 7 Serum <styled-content toggle='no' style='fixed-case'>FST</styled-content> correlated with leukemia progression and therapeutic response in mouse and human <italic><styled-content toggle='no' style='fixed-case'>FLT</styled-content>3</italic>/<styled-content toggle='no' style='fixed-case'>ITD AML</styled-content>

Flt3/ITD knock‐in mouse were genotyped (A). The spleen weight (B and C, 4 mice each) and serum Fst level (D) were measured in WT siblings and Flt3/ITD knock‐in mice (8 mice each). In (C and D), data were presented in box plot. The whiskers, boxes, and central lines represented the minimum‐to‐maximum values, 25th‐to‐75th percentile, and the 50th percentile (median), respectively. **P < 0.01 (Student's t‐test).

The engraftment of MOLM‐13 in NSG mice was confirmed at week 1 post‐injection (E, F). Serum FST level was measured in MOLM‐13‐engrafted NSG mice at pre‐injection and week 2 post‐injection (G, PBS group, 3 mice; MOLM‐13 group, 4 mice). After FST knockdown, serum FST level was also measured in MOLM‐13‐engrafted NSG mice at week 2 post‐injection (H, 3 mice for each group).

Serum FST level was significantly increased in primary AML‐derived xenografted mouse at week 6 post‐injection. Human primary AML cells (FLT3/ITD‐positive, leukemia blasts > 80%, 10 × 106, n = 7) were injected via tail vein into irradiated NSG mice at 6–8 weeks old (I). Human leukemic engraftments were confirmed by flow cytometry of human CD45 and mouse CD45.1 cells in recipient mouse BM aspiration (J). Serum FST from pre‐injection and post‐engraftment mouse was measured (K, one mouse for each primary AML sample).

Correlation between serum FST levels and leukemia blast percentage from FLT3/ITD‐mutated AML at diagnosis. Correlation analysis (Pearson's correlation coefficient) was performed by GraphPad Prism 6.

Serum FST decreased in CR and increased after relapse in 4 AML patients receiving quizartinib monotherapy.

Serum FST continued to rise during disease progression from a patient who did not respond to quizartinib. Patients in (M) and (N) were recruited in the QUANTUM‐R, and patient accrual has been completed.

Data information: In (G and K), data were presented as scatter dot plot. n.s: not significant, *P < 0.05 and **P < 0.01 (Student's t‐test). In (H, M and N), data were presented as mean ± SEM. *P < 0.05 and **P < 0.01 (Student's t‐test).

Acknowledgments
This image is the copyrighted work of the attributed author or publisher, and ZFIN has permission only to display this image to its users. Additional permissions should be obtained from the applicable author or publisher of the image. Full text @ EMBO Mol. Med.