
Fig. 3
- ID
- ZDB-IMAGE-200307-4
- Genes
- Publication
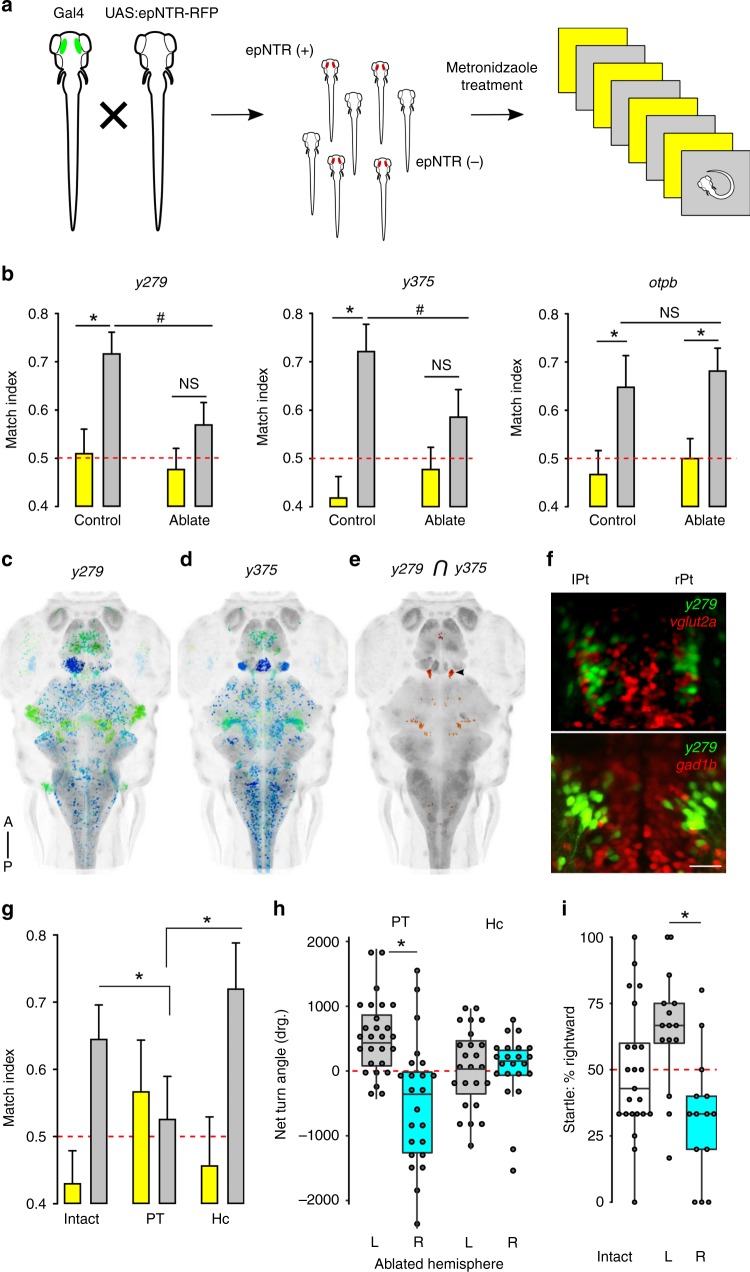
- Horstick et al., 2020 - Molecular and cellular determinants of motor asymmetry in zebrafish
- All Figures
- Figures for Horstick et al., 2020
|
Fig. 3