IMAGE

Figure 1

ID
ZDB-IMAGE-200306-99
Source
Figures for Moreira et al., 2020
Image
Figure Caption

Figure 1

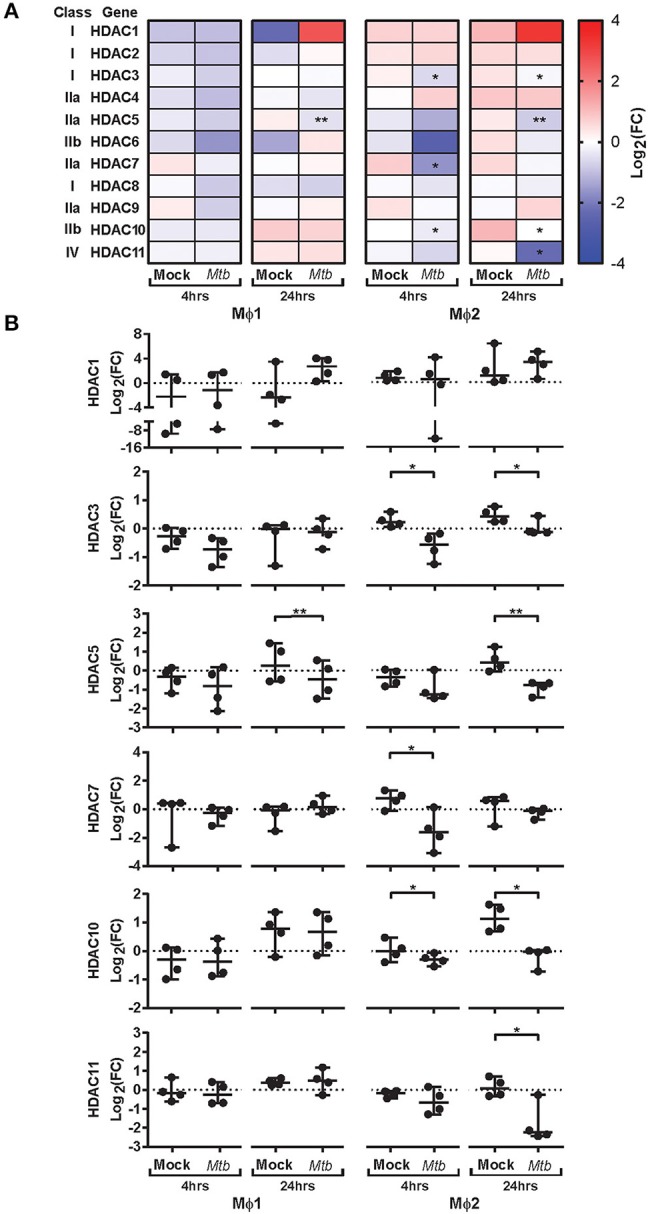
Expression kinetics of HDAC transcripts in primary human macrophages following Mtb infection. Mϕ1 and Mϕ2 derived from 4 different donors were mock infected or infected with Mtb for 1 h at MOI 10. Transcript levels of HDAC1-11 were determined in triplicate using qRT-PCR before (0 h baseline) and 4 and 24 h post-infection. Data was normalized to GAPDH (ΔCt) and mean expression levels of triplicate samples were calculated for each donor. (A) Heatmap displaying median log2 fold changes (FC) of HDAC1-11 expression levels (pooled data of 4 donors) in response to Mtb infection compared to their respective baseline controls. (B) Dot plots displaying log2 FC expression levels of HDAC1, 3, 5, 7, 10, and 11 in response to Mtb infection compared to their respective baseline controls, calculated using the 2−ΔΔCT formula. Each dot represents a single donor. Horizontal lines indicate median log2 FC values of all 4 donors and whiskers represent 95% confidence intervals. Statistically significant differences compared to uninfected controls were tested using a paired sample t-test (*p < 0.05, **p < 0.01).

Acknowledgments
This image is the copyrighted work of the attributed author or publisher, and ZFIN has permission only to display this image to its users. Additional permissions should be obtained from the applicable author or publisher of the image. Full text @ Front Immunol