IMAGE

Fig. 2

ID
ZDB-IMAGE-200306-16
Source
Figures for Lee et al., 2020
Image
Figure Caption

Fig. 2

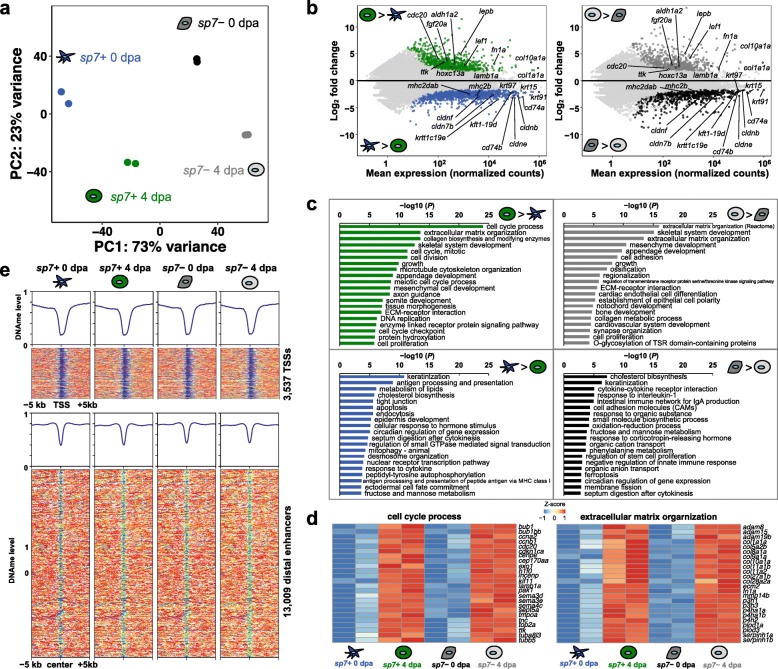
Regeneration-specific genes are activated independent of DNA methylation changes. a Principal component analysis on the transcriptomes of sp7+ and sp7− cells at 0 dpa uninjured fin and 4 dpa blastema. b MA plots for differentially expressed genes during fin regeneration in sp7+ and sp7− cells. Each dot represents log-transformed individual gene expression change. Green and dark gray dots represent statistically significantly upregulated genes during regeneration in sp7+ and sp7− cells, respectively (log2(FC) > 1 and FDR < 0.05). Blue and black dots represent genes statistically significantly downregulated genes during regeneration in sp7+ and sp7− cells, respectively (log2(FC) < − 1 and FDR < 0.05). Light gray dots represent genes with no significant changes. c Gene ontology (GO) terms associated with significantly differentially expressed genes. d Examples of expression pattern of upregulated genes during regeneration that fall within the top GO terms. e DNA methylation levels over 10 kb around the promoters and putative distal enhancers of the significantly differentially expressed genes during regeneration

Acknowledgments
This image is the copyrighted work of the attributed author or publisher, and ZFIN has permission only to display this image to its users. Additional permissions should be obtained from the applicable author or publisher of the image. Full text @ Genome Biol.