IMAGE

Figure 6.

ID
ZDB-IMAGE-200225-19
Source
Figures for Roussel et al., 2020
Image
Figure Caption

Figure 6.

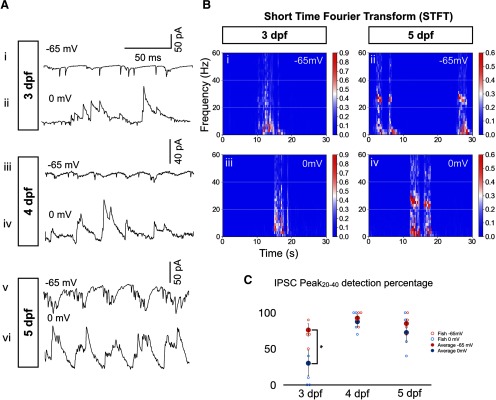
IPSCs mature from arrhythmic at 3 dpf to rhythmic with a frequency close to that of tail beats at 5 dpf during swimming episodes. A, Typical voltage-clamp recordings of MNs during swimming activity at resting (−65 mV) and cation reversal potentials (0 mV) for 3-dpf (Ai, Aii), 4-dpf (Aiii, Aiv), and 5-dpf (Av, Avi) fish. B, Short-time Fourier transform (STFT) of a 30-s-long recording of spinal cord activity under control and strychnine conditions at 3 dpf (Bi, Bii) and 5 dpf (Biii, Biv). White dotted lines mark the 20- to 40-Hz frequency range. We can observe local maxima in the 20- to 40-Hz range for both 5-dpf plots but not for the 0-mV 3-dpf plot. C, Results from Peak20–40 detection algorithm in the 25- to 50-ms time delay range for autocorrelation functions of each traces at 3, 4, and 5 dpf at −65 mV (blue) and 0 mV (red) holding potentials. N = 10 episodes per sMN in five sMN at 3 dpf, in four sMN at 4 dpf, and four sMN at 5 dpf. Error bars display SEM. Two-tailed paired Student’s t test (3 dpf −65 to 0 mV, p = 0.0139; 4 dpf −65 to 0 mV, p = 0.3910; 5 dpf −65 to 0 mV, p = 0.1942); *p < 0.0166, indicating significance with Bonferroni’s multiple-comparisons correction.

Acknowledgments
This image is the copyrighted work of the attributed author or publisher, and ZFIN has permission only to display this image to its users. Additional permissions should be obtained from the applicable author or publisher of the image. Full text @ eNeuro