IMAGE

Fig. 7

ID
ZDB-IMAGE-200102-31
Genes
Source
Figures for Vacca et al., 2019
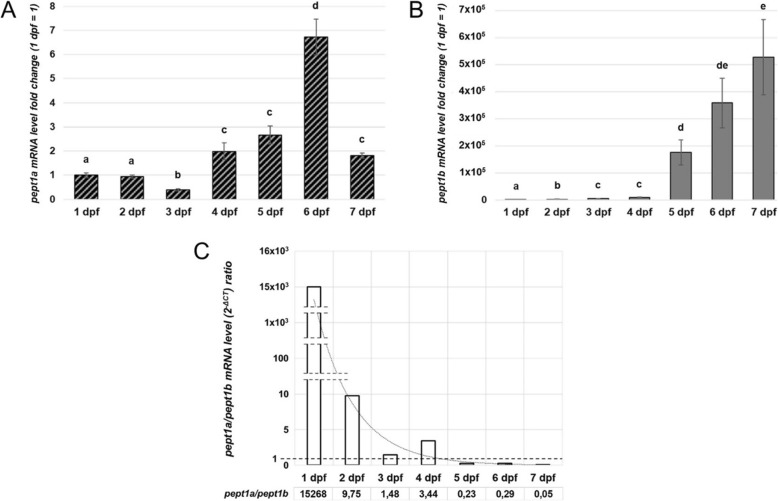
Image
Figure Caption

Fig. 7

Quantitative expression analysis of zebrafish pept1a (slc15a1a) and pept1b (slc15a1b) mRNAs during early development. a mRNA expression analysis by qPCR in zebrafish embryos/larvae from 1 to 7 days post-fertilization (dpf). The levels of pept1a (slc15a1a) mRNA were calculated as 2-ΔCT mean values obtained from two rounds of qPCR assays for each of three independent biological replicates (pools of 10–15 embryos/larvae), and then they were expressed as fold-change (y-axis) with respect to the 1 dpf stage taken as control value (1 dpf = 1). b mRNA expression analysis by qPCR of the pept1b (slc15a1b) gene in zebrafish embryos and larvae from 1 to 7 dpf. Statistical analysis of variance of the means was assessed by one-way ANOVA and Tukey's post hoc test. In histograms, different letters indicate statistically different values (n = 3 independent biological replicates; P < 0.05). c Representation of the trend of the pept1a/pept1b mRNA level ratio at 1 to 7 dpf, based on the 2-ΔCT mean values obtained from the output data deriving from qPCR assays performed, with the same primer efficiency values, for both the pept1a- and pept1b-specific primer pairs

Figure Data
Acknowledgments
This image is the copyrighted work of the attributed author or publisher, and ZFIN has permission only to display this image to its users. Additional permissions should be obtained from the applicable author or publisher of the image. Full text @ Genes Nutr