IMAGE

Fig. 2

ID
ZDB-IMAGE-191230-946
Source
Figures for Hughes et al., 2019
Image
Figure Caption

Fig. 2

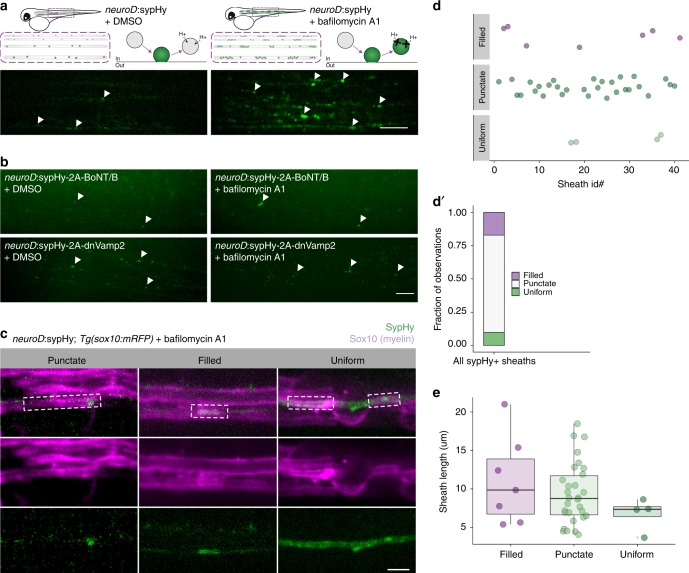
Variable synaptic vesicle exocytosis sites under myelin sheaths. a Left, schematic of Syp-pHluorin (SypHy) function and transient expression in spinal cord neurons and representative max-projection image of a live 4 dpf larva expressing neuroD:sypHy. Arrowheads indicate dim spots of SypHy signal. Right, similar but in the presence of bafilomycin A1 to inhibit vesicle reacidification. Note appearance of several large SypHy + “hotspots” along axons. Scale bar, 10 µm. b Similar to a except larvae are co-expressing inhibitors of exocytosis, botulinum toxin (BoNT/B) or dominant-negative Vamp2 (dnVamp2). Both BoNT/B and dnVamp2 suppress bafilomycin induction of SypHy hotspots. Arrowheads indicate a few visible SypHy spots. Scale bar, 10 µm. c Expression of neuroD:sypHy in Tg(sox10:mRFP) larvae treated with bafilomycin reveals three types of SypHy-reported exocytosis sites under myelin sheaths: punctate, filled, and uniform. Boxes outline individual myelin sheaths. Scale bar, 5 µm. d Classification plot of SypHy signal under 41 sheaths (from n = 20 larvae) by category. Presented as a bar in d′ for visible contribution of each category to the total. e No association between category and sheath length, Kruskal–Wallis test

Acknowledgments
This image is the copyrighted work of the attributed author or publisher, and ZFIN has permission only to display this image to its users. Additional permissions should be obtained from the applicable author or publisher of the image. Full text @ Nat. Commun.