IMAGE

Figure 1

ID
ZDB-IMAGE-191230-937
Source
Figures for Xu et al., 2019
Image
Figure Caption

Figure 1

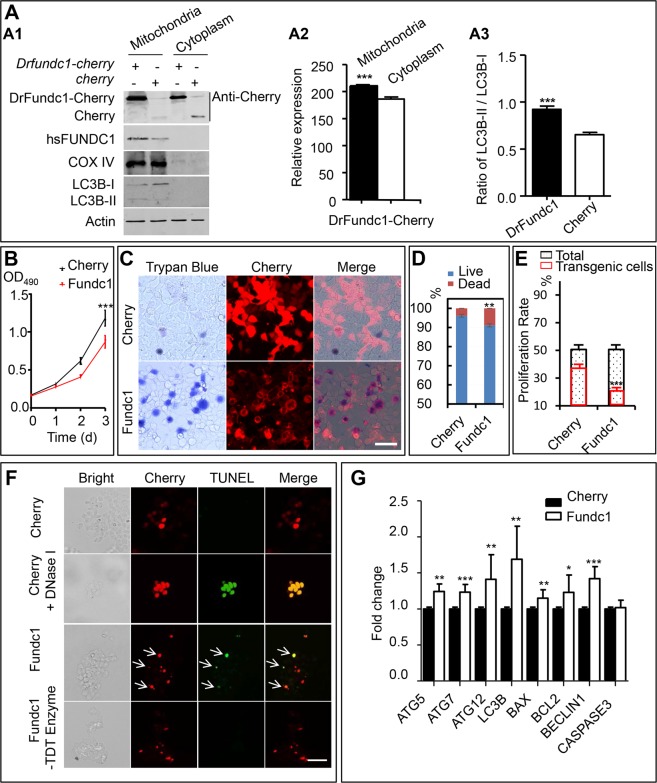
DrFundc1 reduced cell viability while inducing autophagy and apoptosis in transgenic 293 T cells. (A) Western blotting of proteins extracted from mitochondria and cytoplasm from transgenic 293 T cells transfected with pCS2 + -Drfundc1-Cherry-His as well as pCS2 + -Cherry plasmids. Antibodies used were anti-Cherry (detecting Drfundc1-Cherry-His and Cherry), anti-FUNDC1, anti-COX IV, anti-LC3B, and anti-β-ACTIN. (A1) Results of Western blotting. (A2) Gray-scale analyses of DrFundc1 using ImageJ in mitochondria and cytoplasm of cells transfected with pCS2 + -Drfundc1-Cherry-His. (A3) LC3B-II:LC3B-I ratio in mitochondria of transgenic cells transfected with pCS2 + -Drfundc1-Cherry-His and pCS2 + -Cherry. (B) DrFundc1 decreased viability of 293 T cells, measured by MTT assay. (C-D) DrFundc1 increased 293 T cell mortality, measured by Trypan Blue staining. (E) DrFundc1 decreased cell proliferation in transgenic cells, detected using BrdU incorporation. (F) DrFundc1 led to apoptosis of 293 T cells, detected using TUNEL assay. Arrows show apoptotic cells. Red indicates DrFundc1-Cherry or Cherry, while green indicates TUNEL-positive cells. Positive control: Cherry + DNase I. Negative control: incubation without TdT enzyme. (G) Expressional fold change of autophagy- and apoptosis-related genes, detected using qRT-PCR. β-ACTIN was used as an internal control. Significant differences between cells transfected with different plasmids are shown as asterisks. *P < 0.05; **P < 0.01; ***P < 0.001.

Acknowledgments
This image is the copyrighted work of the attributed author or publisher, and ZFIN has permission only to display this image to its users. Additional permissions should be obtained from the applicable author or publisher of the image. Full text @ Sci. Rep.