IMAGE

Figure 3

ID
ZDB-IMAGE-191230-393
Source
Figures for Duan et al., 2019
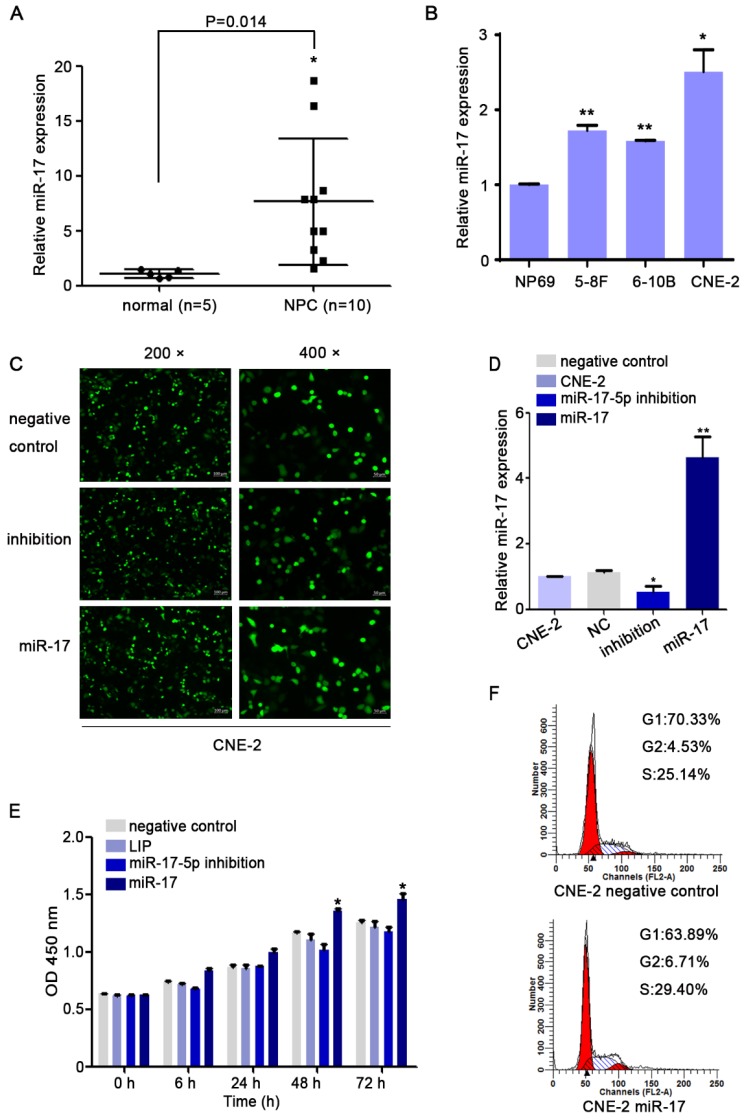
Image
Figure Caption

Figure 3

MiR-17-5p knockdown suppressed the proliferation of CNE2. A: MiR-17-5p expression in 10 NPC tissues and 5 normal nasopharyngeal tissues by Real-time PCR analysis. B: Relative miR-17-5p expression in NPC cell lines and normal nasopharyngeal epithelial cell line. U6 was an endogenous control. (C-D): Immunofluorescence analysis and Real-time PCR analysis of miR-17-5p expression after CNE-2 cells transfected with plasmids. E: Proliferation of CNE-2 cells was examined using CCK-8 assay after transfected with miR-17-5p inhibition plasmid, miR-17 plasmid and negative control. F: Cell cycle analysis by flow cytometry in CNE-2 cells containing different levels of miR-17-5p. The data shown were representative of at least three independent experiments. * p < 0.05. ** p< 0.01.

Acknowledgments
This image is the copyrighted work of the attributed author or publisher, and ZFIN has permission only to display this image to its users. Additional permissions should be obtained from the applicable author or publisher of the image. Full text @ J Cancer