IMAGE

Figure 2

ID
ZDB-IMAGE-191230-192
Source
Figures for Molagoda et al., 2019
Image
Figure Caption

Figure 2

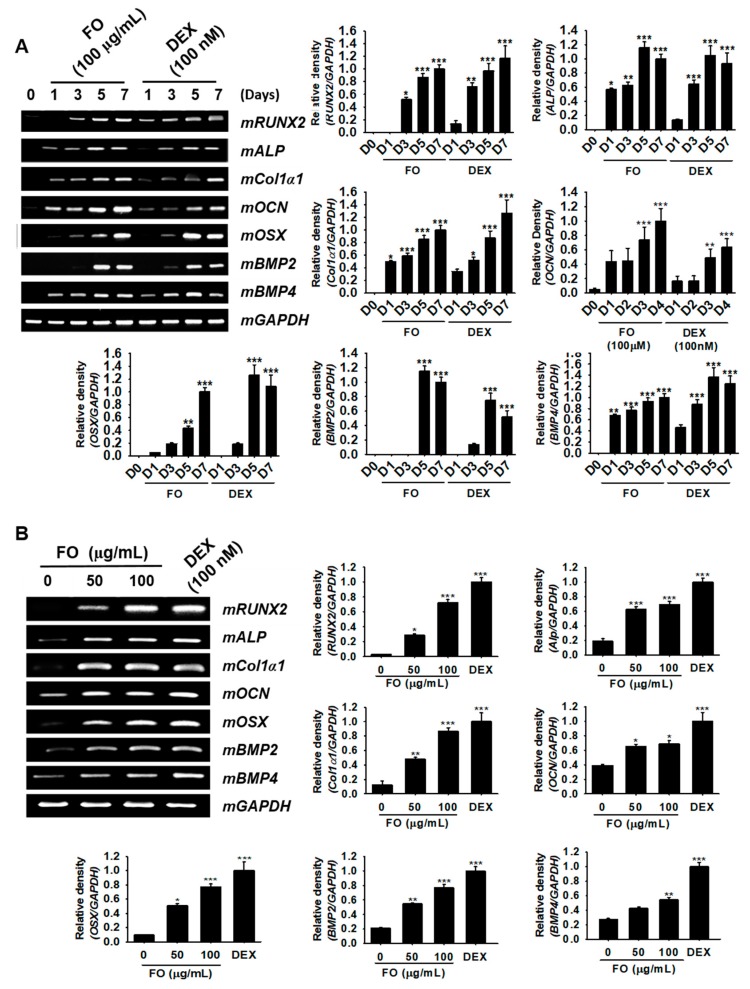
FO upregulates the specific marker gene expression responsible for osteoblast differentiation in MC3T3-E1 cells. (A) MC3T3-E1 cells were treated with 100 µg/mL of FO and 100 nM DEX for 7 days. The expression of mRUNX2, mALP, mCol1a1, mOCN, mOSX, mBMP2, and mBMP4 was measured on day 1 (D1), day 3 (D3), day 5 (D5), and day 7 (D7). (B) The cells were also treated with 50 µg/mL and 100 µg/mL of FO or 100 nM DEX for 5 days. The expression of mRUNX2, mALP, mCol1a1, mOCN, mOSX, mBMP2, and mBMP4, was observed. mGAPDH was used as a house keeping gene. Significant differences among the groups were determined using the one-way ANOVA followed by Bonferroni correction. All data are presented as mean ± SEM (*** p < 0.001, ** p < 0.01, and * p < 0.05 versus untreated group). FO; fermented extract of C. gigas and DEX; dexamethasone.

Acknowledgments
This image is the copyrighted work of the attributed author or publisher, and ZFIN has permission only to display this image to its users. Additional permissions should be obtained from the applicable author or publisher of the image. Full text @ Biomolecules