
Fig. 5.
- ID
- ZDB-IMAGE-191230-1890
- Publication
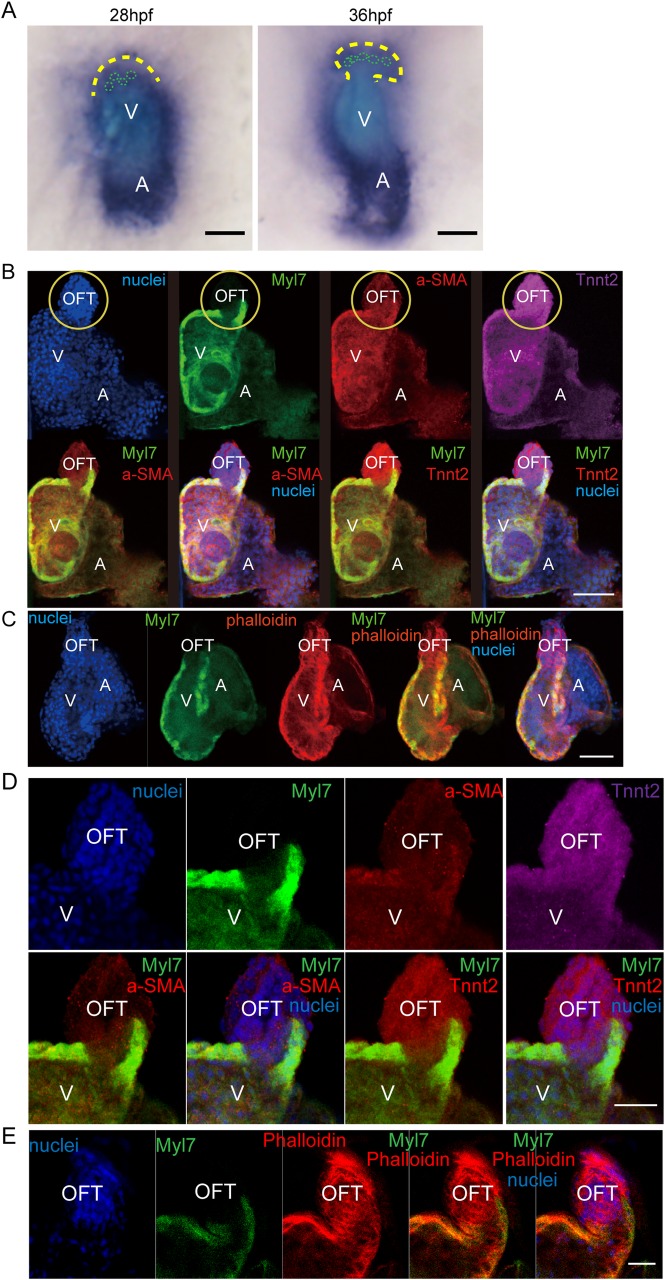
- Liu et al., 2019 - Combinatorial genetic replenishments in myocardial and outflow tract tissues restore heart function in tnnt2 mutant zebrafish
- All Figures
- Figures for Liu et al., 2019
|
Fig. 5.