
Figure 2
- ID
- ZDB-IMAGE-191230-1880
- Publication
- Klingseisen et al., 2019 - Oligodendrocyte Neurofascin Independently Regulates Both Myelin Targeting and Sheath Growth in the CNS
- All Figures
- Figures for Klingseisen et al., 2019
|
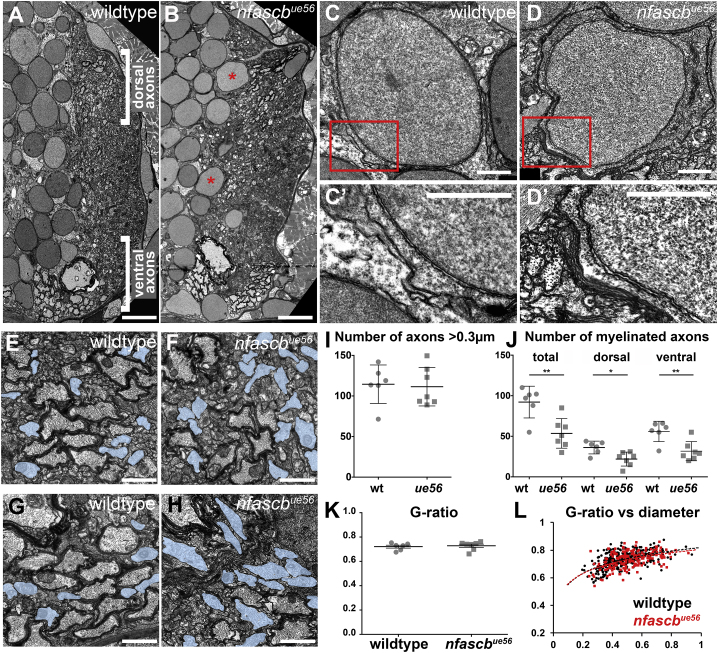
Figure 2
Ultrastructural Analyses of the
(A and B) Transmission electron microscopy (TEM) images of sections through the spinal cord of wildtype (A) and
(C–D′) TEM images of cell bodies in wildtype (C and C′) and
(E–H) High magnification views of myelinated axons in the dorsal (E and F) and ventral (G and H) spinal cord of wildtype (E) and mutant (F) animals. Unmyelinated axons with a diameter >0.3 μm highlighted in blue. Scale bars, 0.5 μm.
(I) Number of axons with a diameter > 0.3 μm in wildtype and
(J) Total number of myelinated axons in wildtype and
(K) Average g-ratio per animal in wildtype and
(L) G-ratios of all myelinated axons assessed in the dorsal spinal cord of wildtype (black) and
Reprinted from Developmental Cell, 51(6), Klingseisen, A., Ristoiu, A.M., Kegel, L., Sherman, D.L., Rubio-Brotons, M., Almeida, R.G., Koudelka, S., Benito-Kwiecinski, S.K., Poole, R.J., Brophy, P.J., Lyons, D.A., Oligodendrocyte Neurofascin Independently Regulates Both Myelin Targeting and Sheath Growth in the CNS, 730-744.e6, Copyright (2019) with permission from Elsevier. Full text @ Dev. Cell