
Figure 1
- ID
- ZDB-IMAGE-191230-1588
- Genes
- Publication
- Young et al., 2019 - Developmentally regulated Tcf7l2 splice variants mediate transcriptional repressor functions during eye formation
- All Figures
- Figures for Young et al., 2019
|
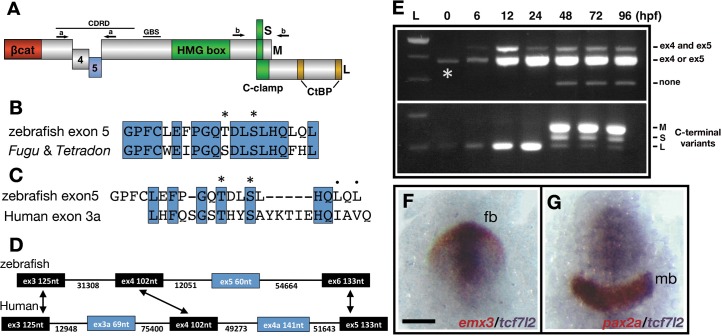
Figure 1 (A) Schematic representation of variants of Tcf7l2 arising from different splice forms (not to scale). Labels 4 and 5 represent the region of Tcf7l2 coded by alternative exons 4 and 5. Short (S) Medium (M) and Long (L) C-terminal variants coded by alternative splice variants in the 5’ end of exon 15 are indicated. Red box, β-catenin (βcat) binding domain. Green boxes, High-Mobility Group (HMG) Box, which is the primary DNA interacting domain, and C-clamp DNA-helper binding domain. Yellow boxes, CtBP interaction domains. CDRD labelled line over exons 4 and 5 indicates the Context Dependent Regulatory Domain and Groucho Binding Site (GBS) marks the region of interaction with Groucho/Tle transcriptional co-repressors. Arrows indicate the position of primer sets ‘a’ and ‘b’ used for RT-PCR experiments in (E). (B–C) Alignment of the amino acid sequences coded by zebrafish, Takifugu rubripens and Tetradon tcf7l2 exon 5 (B) or human exon 3a (C). Identical amino acids marked by blue boxes. Asterisks over sequence mark putative phosphorylated amino acids. Dots over sequence indicate similar amino acids. (D) Schematic of the genomic region of zebrafish and human tcf7l2. Introns depicted as lines and exons as boxes. Blue exon boxes depict human tcf7l2 alternative exons 3a and 4a, and zebrafish alternative exon 5. Black exon boxes indicate equivalent exons in both species emphasised by arrows. Numbers under introns and within exons represent their nucleotide size (not to scale). (E) RT-PCR experiments performed on cDNA from embryos at stages indicated in hours post fertilisation (hpf). L, 1 Kb ladder. Top panel shows results of PCRs using primer set ‘a’ (indicated in Figure 1A, Materials and methods) amplifying the region of alternative exons 4 and 5. Middle band contains amplicons including either tcf7l2 exon 4 or exon 5. Bottom panel shows results of PCRs using primer set ‘b’ (indicated in Figure 1A, Materials and methods) amplifying the region of alternative exon 15. Asterisk shows maternal expression of tcf7l2. (F–G) Double in situ hybridisation of tcf7l2, in blue, and emx3 (F) or pax2a (G) in red. 10hpf flat mounted embryos, dorsal view, anterior up, posterior down; fb, prospective forebrain; mb, prospective midbrain. Scale Bar in (F) is 200 µm