IMAGE

Fig. 3

ID
ZDB-IMAGE-191230-140
Genes
Source
Figures for Gómez-Abenza et al., 2019
Image
Figure Caption

Fig. 3

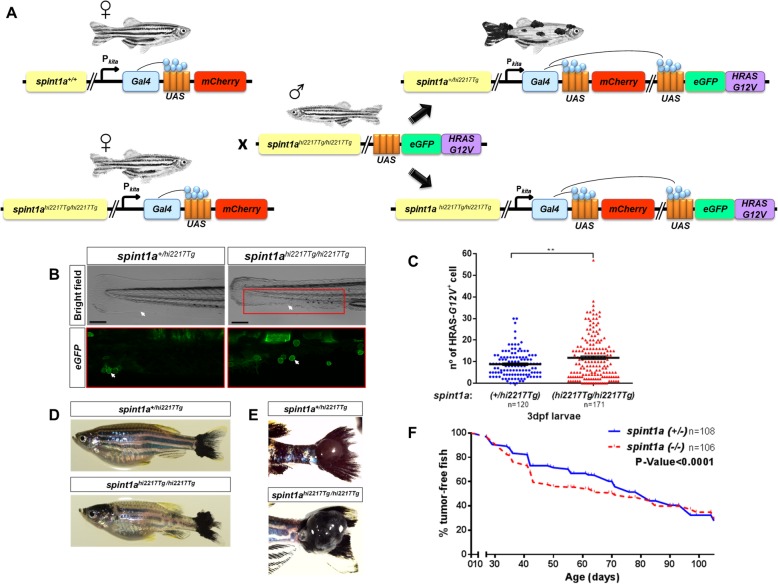
Inflammation accelerates the onset of SKCM in zebrafish. a Schematic diagram of the generation of the SKCM model line in zebrafish with Spint1a deficiency. b and c Representative images (b) and number of early oncogenically transformed eGFP-HRAS-G12V+ cells in the boxed area (c) in Spint1a-deficient larvae and control siblings at 3 dpf. Note the morphological alterations observed in the inflamed skin of the mutants (white arrows). eGFP-HRAS-G12V+ goblet cells are marked with white arrows. Scale bar 250 μm. Each point on the scatter plot represents one larva and the mean ± SEM is also shown. ** p < 0.05 according to an unpaired Student t test with Welch’s correction. d-f Impact of Spint1a deficiency on SKCM onset in zebrafish. Representative images of whole fish (d) and of nodular tail tumors (e), and Kaplan-Meier curve showing the percentage of SKCM-free fish in control and Spint1a-deficient adult fish (f). p < 0.0001 according to a Log rank Mantel-Cox test; Hazard ratio = 0.7962; 95% CI of ratio = 0.6834–0.9056

Figure Data
Acknowledgments
This image is the copyrighted work of the attributed author or publisher, and ZFIN has permission only to display this image to its users. Additional permissions should be obtained from the applicable author or publisher of the image. Full text @ J. Exp. Clin. Cancer Res.