
FIGURE 3
- ID
- ZDB-IMAGE-191230-1198
- Antibodies
- Publication
- Arribat et al., 2019 - Mitochondria in Embryogenesis: An Organellogenesis Perspective
- All Figures
- Figures for Arribat et al., 2019
|
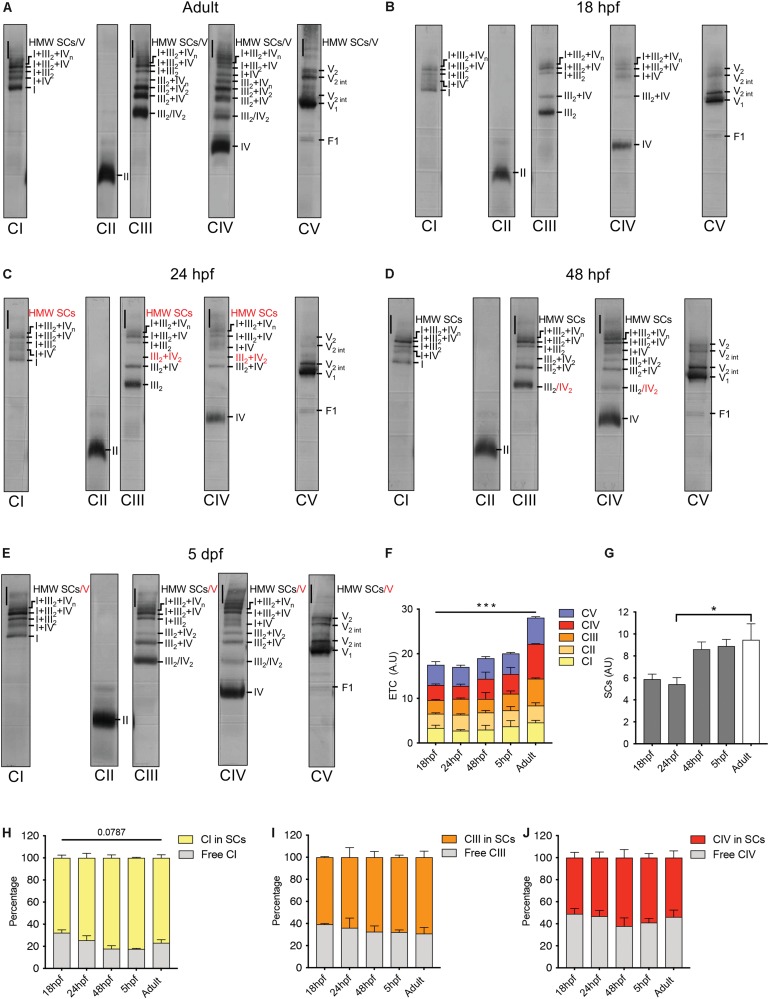
FIGURE 3
Electron transport chain supercomplexes are qualitatively stable throughout zebrafish development.