
Image
|
Figure Caption
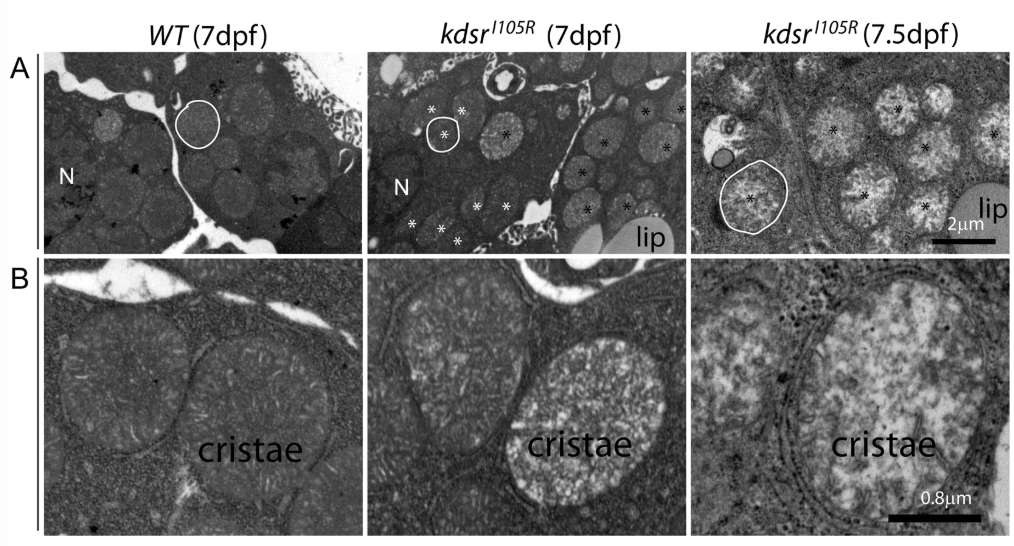
Fig. 3 Transmission electron microscopy (TEM) imaging of hepatocytes. 8,000x magnification in wild type at 7 dpf (left), kdsrI105R mutant at 7 dpf with mild phenotype (middle), and kdsrI105R mutant at 7.5 dpf with severe defect (right) ( A). One of representative mitochondria is outlined with white color. N, nucleus. Normal looking mitochondria and abnormal mitochondria were marked with white and black asterisks, respectively. 20,000x magnification images are shown in ( B). Images shown are representative of 2 other animals. Scale bars = 2 µm (panel A), 0.8 µm (panel B). Lip, lipid drops.