
|
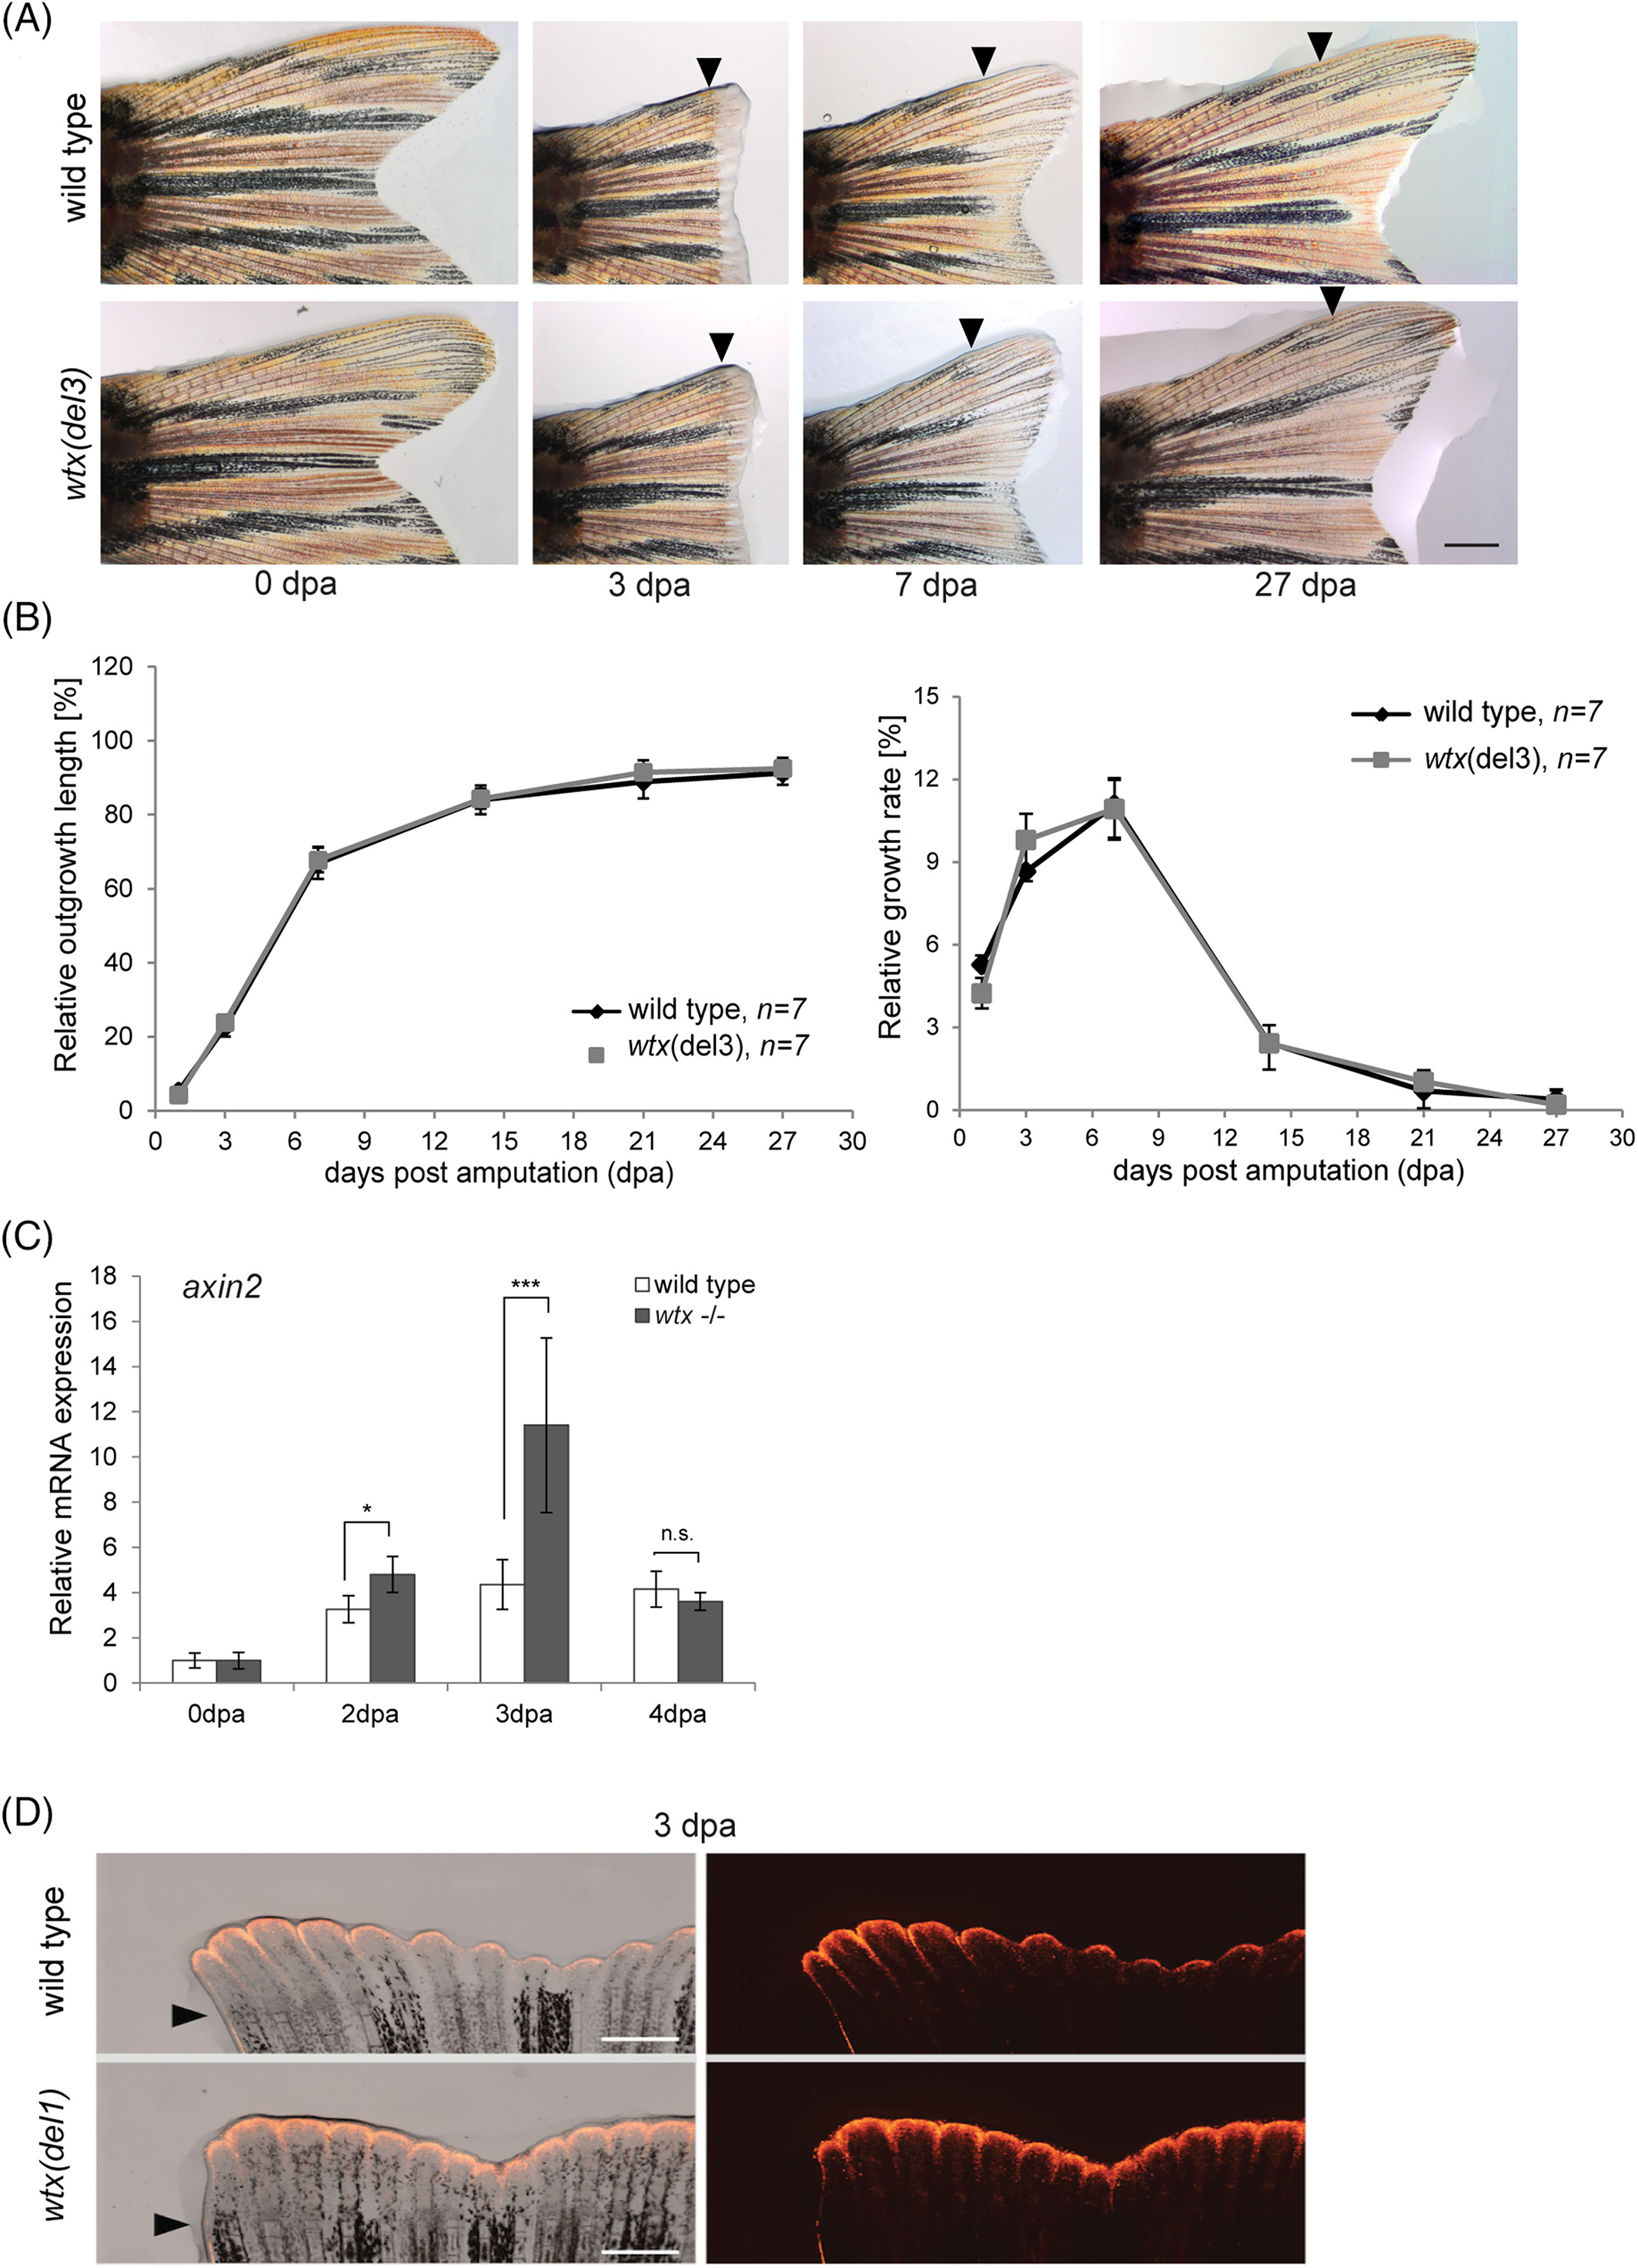
Fig. 4
Loss of wtx increases Wnt/β‐catenin activity during caudal fin regeneration. A, Images of representative regenerating tail fins (dorsal side) in wild type and in wtx del3 mutant zebrafish after 50% amputation. Re‐growing fins were monitored for 27 days. Displayed are 0, 3, 7 and 27 dpa. Black arrowheads indicate the amputation plane. Scale bar represents 1 mm. B, Relative outgrowth kinetics of length and growth rate, measured over 27 days of regeneration. Displayed are mean values. Error bars represent SD. C, Relative mRNA expression of axin2 in uninjured fins (0 dpa) and regenerating fin tissues at 2 dpa, 3 dpa and 4 dpa of wild type and homozygous wtx mutants ( wtx del1 , wtx del2 and wtx del3 ) fish using qRT‐PCR. Gene expression was normalized to uninjured fin (0 dpa) and to the reference gene ef1. Three samples per time point were analyzed consisting of 3 to 4 animals each. Error bars display SE of the mean (SEM). P‐values according to the two‐tailed Student's t‐test: * P < .05; *** P < .001; n.s.: not significant. D, Fin regenerates of wtx(del1) mutant fish and wild type controls at 3 dpa following 50% fin amputation in a Tg(TCFsiam:mCherry) background shows expanded fluorescent signals (red) in wtx mutants (exposure time: 3 seconds). Six wild type and six mutant animals were analyzed. Black arrowheads indicate amputation plane. Scale bars represent 500 μm