
|
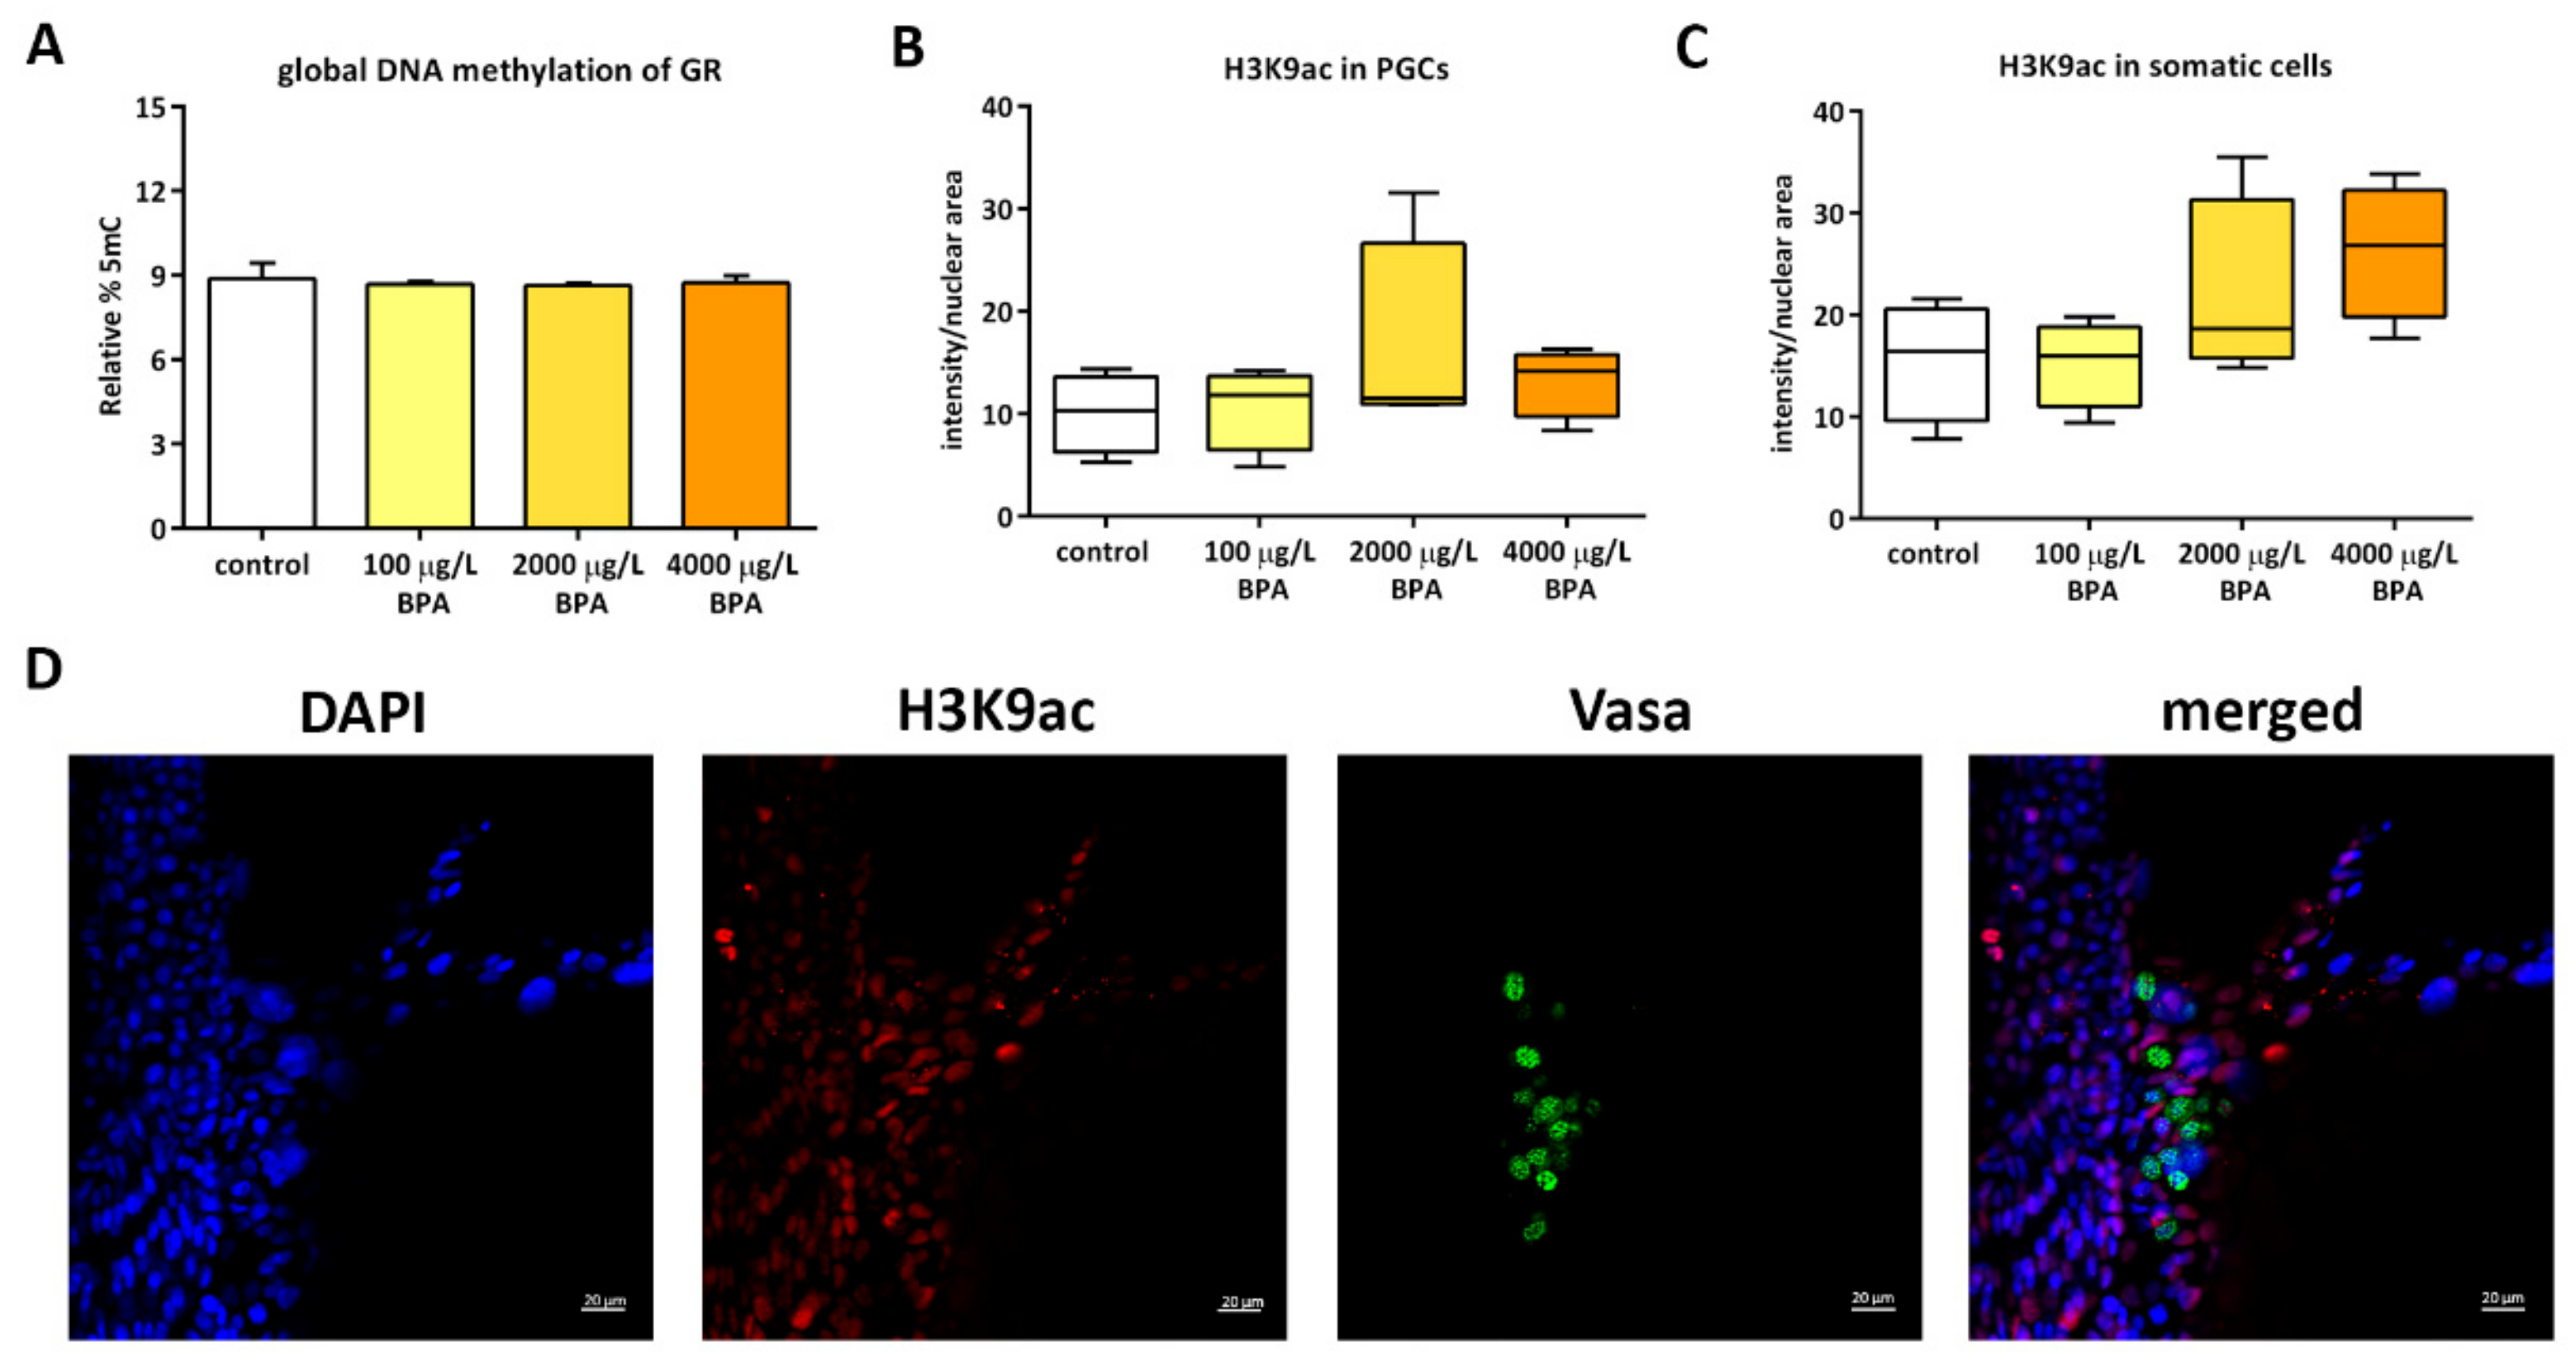
Fig. 2
Epigenetic profile of PGCs and their somatic surrounding cells. (A) Quantification of 5 mC by UPLC-MS in DNA of genital ridges (GR) from control and BPA-treated embryos. Bars represent the percentage of 5mC relative to C in 3 pools of 20 genital ridges per treatment (n = 3). Quantification of H3K9ac by whole mount immunofluorescence in (B) germ cells and (C) somatic cells of 24 hpf control and BPA-exposed embryos. Boxes represent the median plus maximum and minimum of H3K9ac intensity relative to nuclear area in 4 independent experiments (n = 4). (D) confocal images of double immunostaining in genital ridges of 24 hpf control embryos. H3K9ac was labelled with AlexaFluor®568 (red fluorescence), Vasa protein within PGCs was labelled with AlexaFluor®488 (green fluorescence) and nuclei were stained with DAPI (in blue); scale bar 20 µm.