
Fig. S2
- ID
- ZDB-IMAGE-190822-37
- Publication
- Sanz-Morejón et al., 2019 - Wilms Tumor 1b Expression Defines a Pro-regenerative Macrophage Subtype and Is Required for Organ Regeneration in the Zebrafish
- All Figures
- Figures for Sanz-Morejón et al., 2019
|
Fig. S2
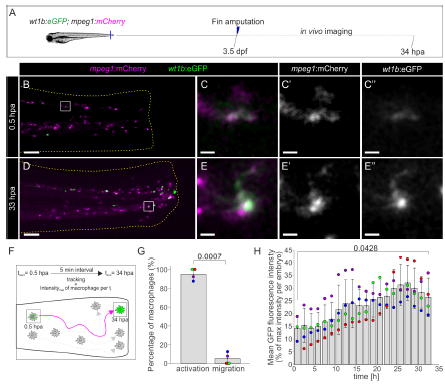
Activation of wt1b :eGFP during migration towards the amputation plane. Related to Figure 3. A, Caudal fins from Tg(wt1b:eGFP;mpeg1:mCherry) zebrafish larvae were amputated at 3.5 dpf and in vivo imaging was performed from 0.5 to 34 hpa. B, Overview of merged eGFP and mCherry channels at 0.5 hpa. C– C’’, Merged and single eGFP and mCherry channels of the zoomed views from boxed areas in panel B are shown. D, Overview of merged eGFP and mCherry channels at 33 hpa. E–E’’, Merged and single eGFP and mCherry channels of the zoomed views from boxed areas in panel B are shown. F, Scheme of macrophage tracking and fluorescence intensity measurement. wt1b:eGFP+ macrophages were tracked during the entire movie and the maximal GFP intensity within the macrophage was detected simultaneously. G, For each of 41 tracked macrophages in 4 embryos an intensity- and localization-based decision (25 % most anterior location and at least 33 % of the macrophage’s maximal intensity) defines whether they upregulate wt1b:eGFP during migration or are eGFP+ from the initial time of tracking. The graph shows the overall mean percentage of upregulation (activation) and migration as bars plus the percentage for each of 4 embryos. H, Overall mean GFP intensity of the 41 tracked macrophages at different time points (grey bars). Colored dots indicate mean GFP intensity Å} SD of macrophages in each of the 4 larvae. eGFP levels over time were normalized by maximal measured intensity per larvae. Timeintervals of 1.7 h (20 x 5 min) were binned. Paired t-test was performed. Scale bars: overview images 100 μm (B nd D), zoomed views 10 μm (C-C’’and E-E’’).