
Fig. S2
- ID
- ZDB-IMAGE-190808-20
- Publication
- Shamipour et al., 2019 - Bulk Actin Dynamics Drive Phase Segregation in Zebrafish Oocytes
- All Figures
- Figures for Shamipour et al., 2019
|
Fig. S2
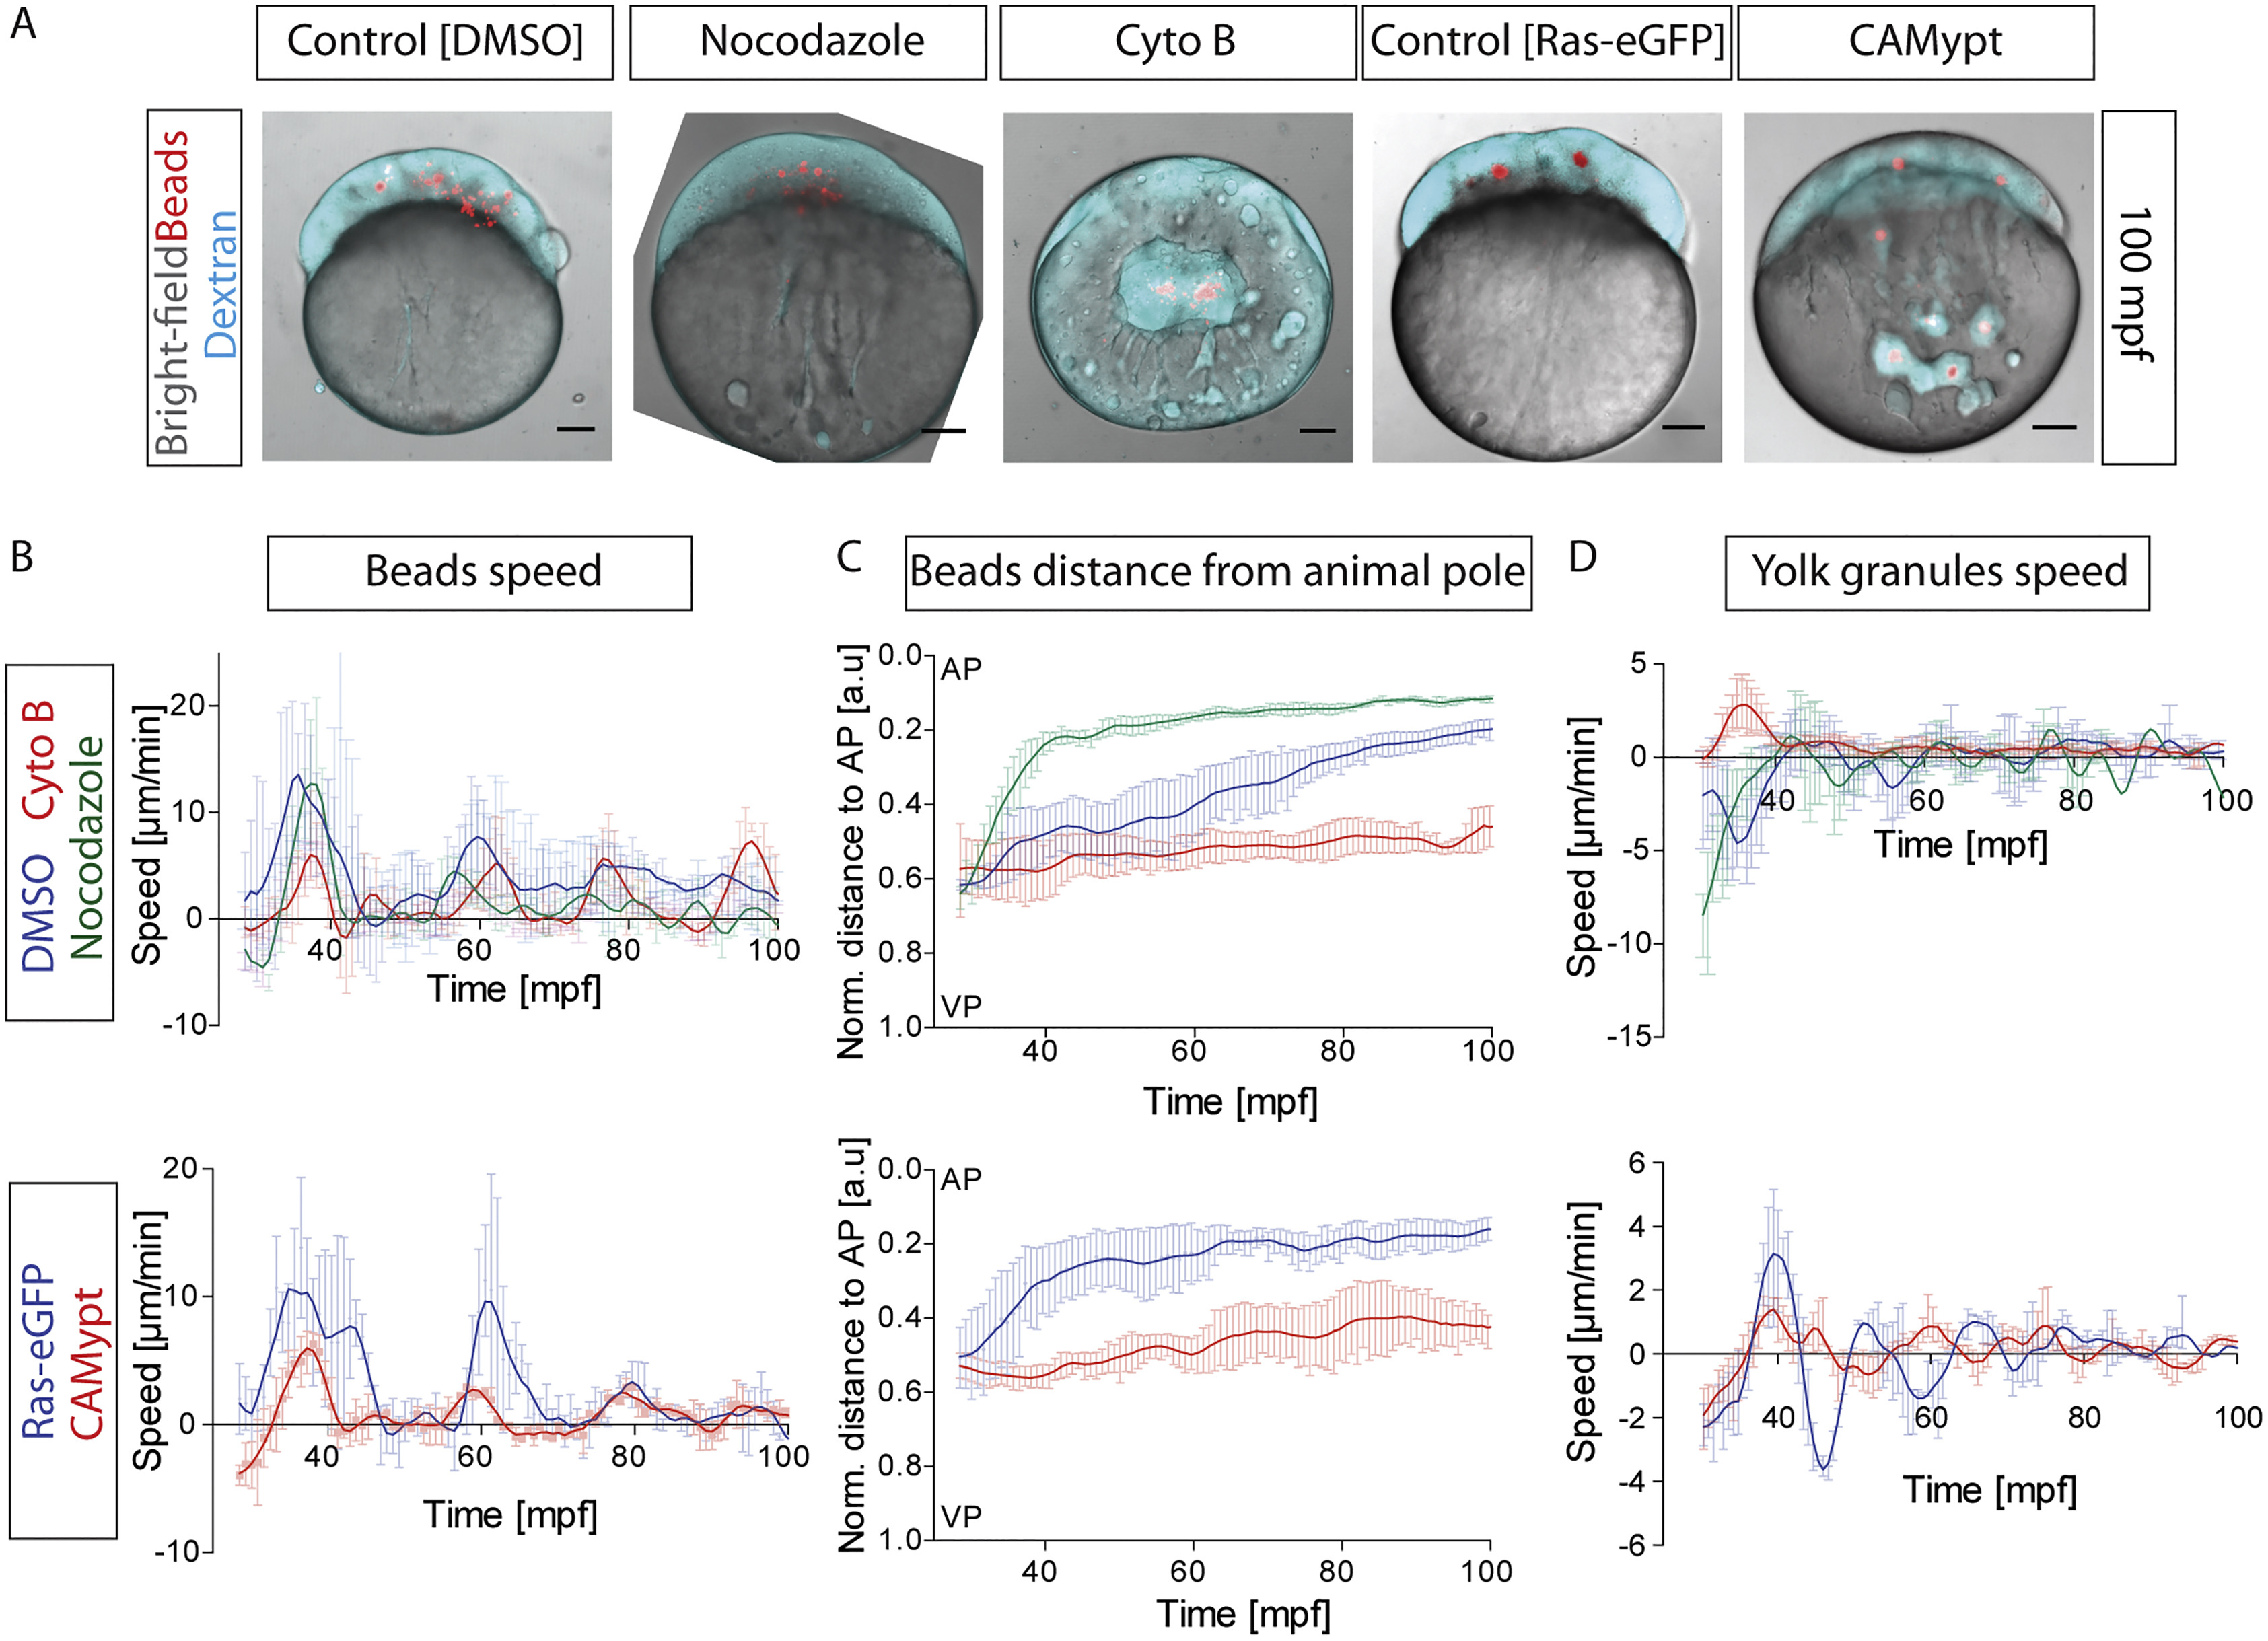
Requirement of the Actomyosin Cytoskeleton for Ooplasm-Yolk Granules Segregation, Related to Figure 2
(A) Fluorescence/bright-field images of oocytes exposed to DMSO (control), Nocodazole (50μg/ml) or Cytochalasin B (Cyto B, 100μg/ml) or injected with CAMypt mRNA (85 pg/embryo) at 100 mpf. Oocytes were also injected with Dextran-Alexa Fluor 647 (cyan) to label the ooplasm, polystyrene beads (red, 2 μm) to track ooplasm flows, and Ras-eGFP (130 pg/embryo) for controlling the CAMypt overexpression experiments. Scale bars, 100 μm. (B) Averaged speed of injected beads as readout of ooplasm flows during the first 100 mpf. Upper plot: DMSO, blue with N = 3 experiments, n = 3 oocytes; Cytochalasin B (Cyto B), red with N = 3 experiments, n = 3 oocytes; Nocodazole, green with N = 4 experiments, n = 4 oocytes. Lower plot: Ras-eGFP, blue with N = 3 experiments, n = 3 oocytes; CAMypt, red with N = 2 experiments, n = 2 oocytes. (C) Normalized and averaged distance of beads to the animal pole of the oocyte during the first 100 mpf. Color coding and N/n as in (B). 0 and 1 on y axis correspond to animal and vegetal poles, respectively. (D) Averaged speed of marginal YGs marked by 1% NileRed during the first 100 mpf. Color coding and N/n as in (B). Error bars, SEM.
Reprinted from Cell, 177(6), Shamipour, S., Kardos, R., Xue, S.L., Hof, B., Hannezo, E., Heisenberg, C.P., Bulk Actin Dynamics Drive Phase Segregation in Zebrafish Oocytes, 1463-1479.e18, Copyright (2019) with permission from Elsevier. Full text @ Cell