
|
Fig. 1-S1
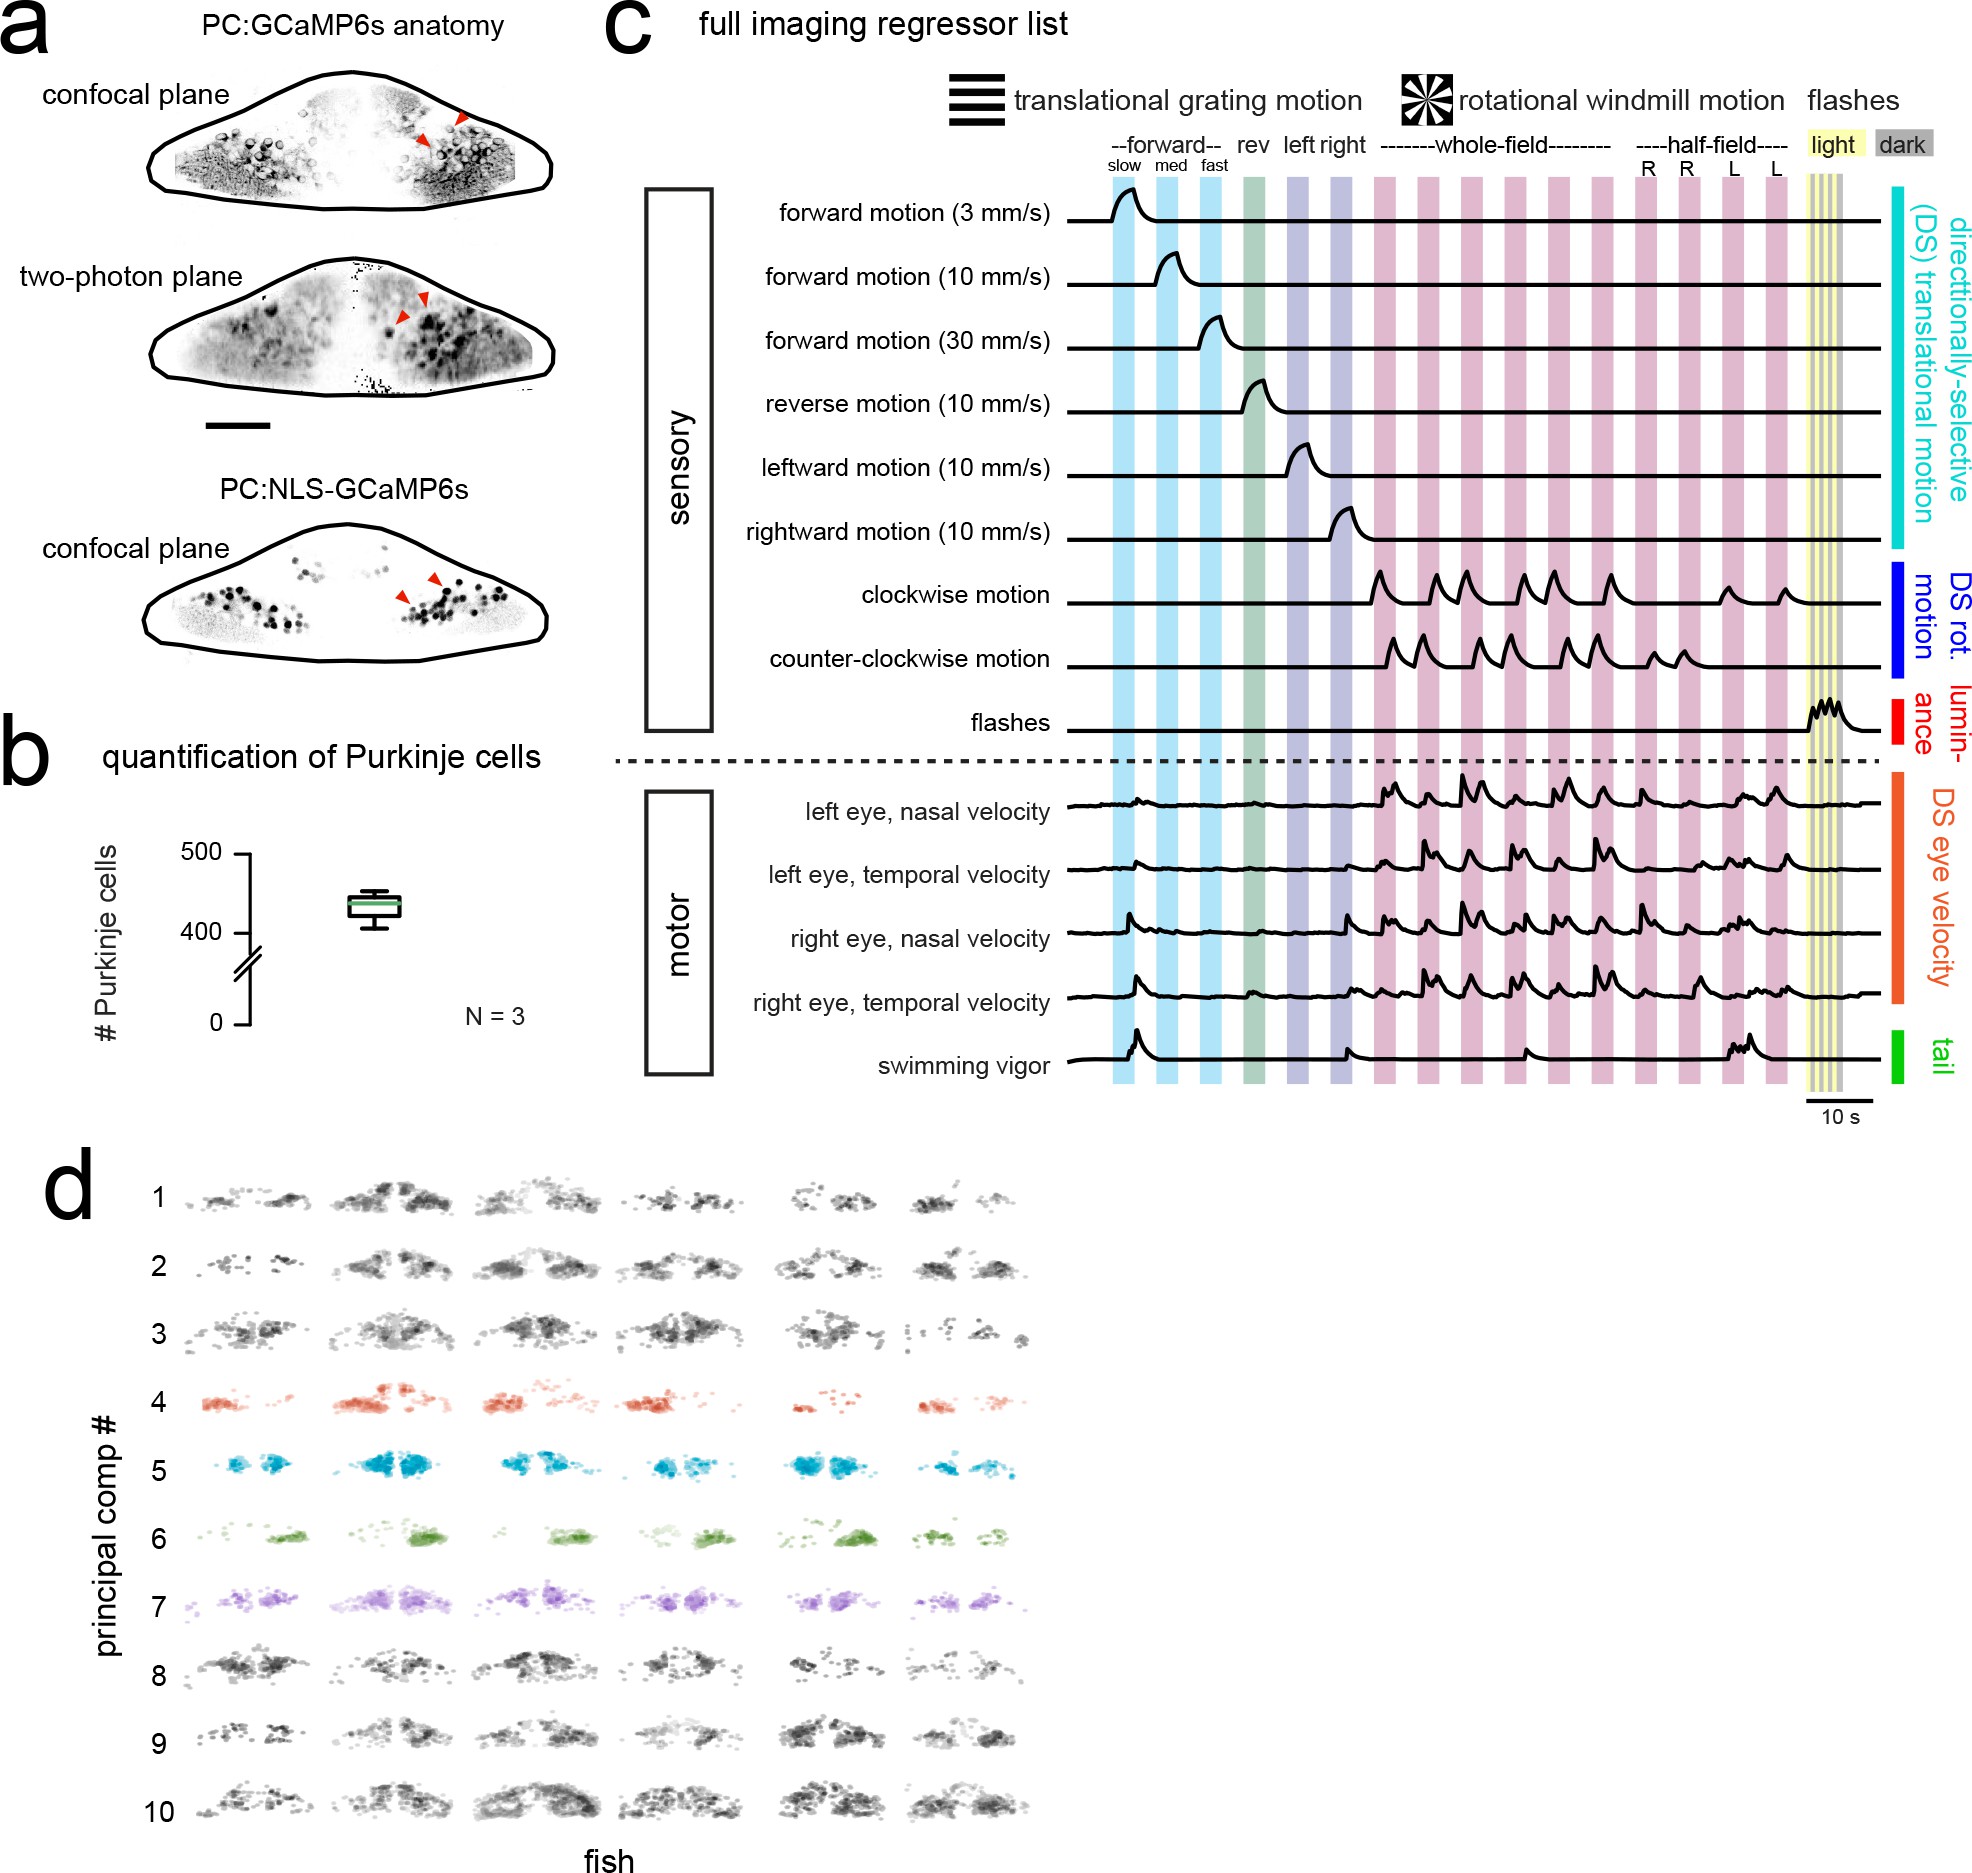
Functional imaging anatomy and full regressor list.
(a) Single imaging planes showing PC:GCaMP6s fluorescence as obtained from confocal imaging (upper panel) and during two-photon experiments (middle panel). Lower panel, a single confocal imaging plane from a PC:NLS-GCaMP6s fish where GCaMP is restricted to the nucleus. Red arrowheads indicate example Purkinje cell somata. Scale car = 25 microns. (b) Quantification of Purkinje cells in the entire cerebellum at seven dpf as counted in the PC:NLS-GCaMP6s line. N = 3 fish. (c) The complete set of regressors used in analysis of calcium imaging data. Individual regressors fall into one of five categories (three sensory and two motor), as indicated by the categories at right. Tail and eye motor regressors are calculated for each imaging plane based on the motor activity during that trial, therefore a representative example from one trial in the dataset is shown here. See also Videos 1 and 2 for example imaging trials with the sequence of visual stimuli displayed. (d) Projections of the first ten principal components of Purkinje cell activity in response to experimental stimuli across all fish (N = 6; see Materials and methods), ordered in increasing variance explained. Components that show a high degree of anatomical clustering are colored. Colors are arbitrarily chosen.