
Image
|
Figure Caption
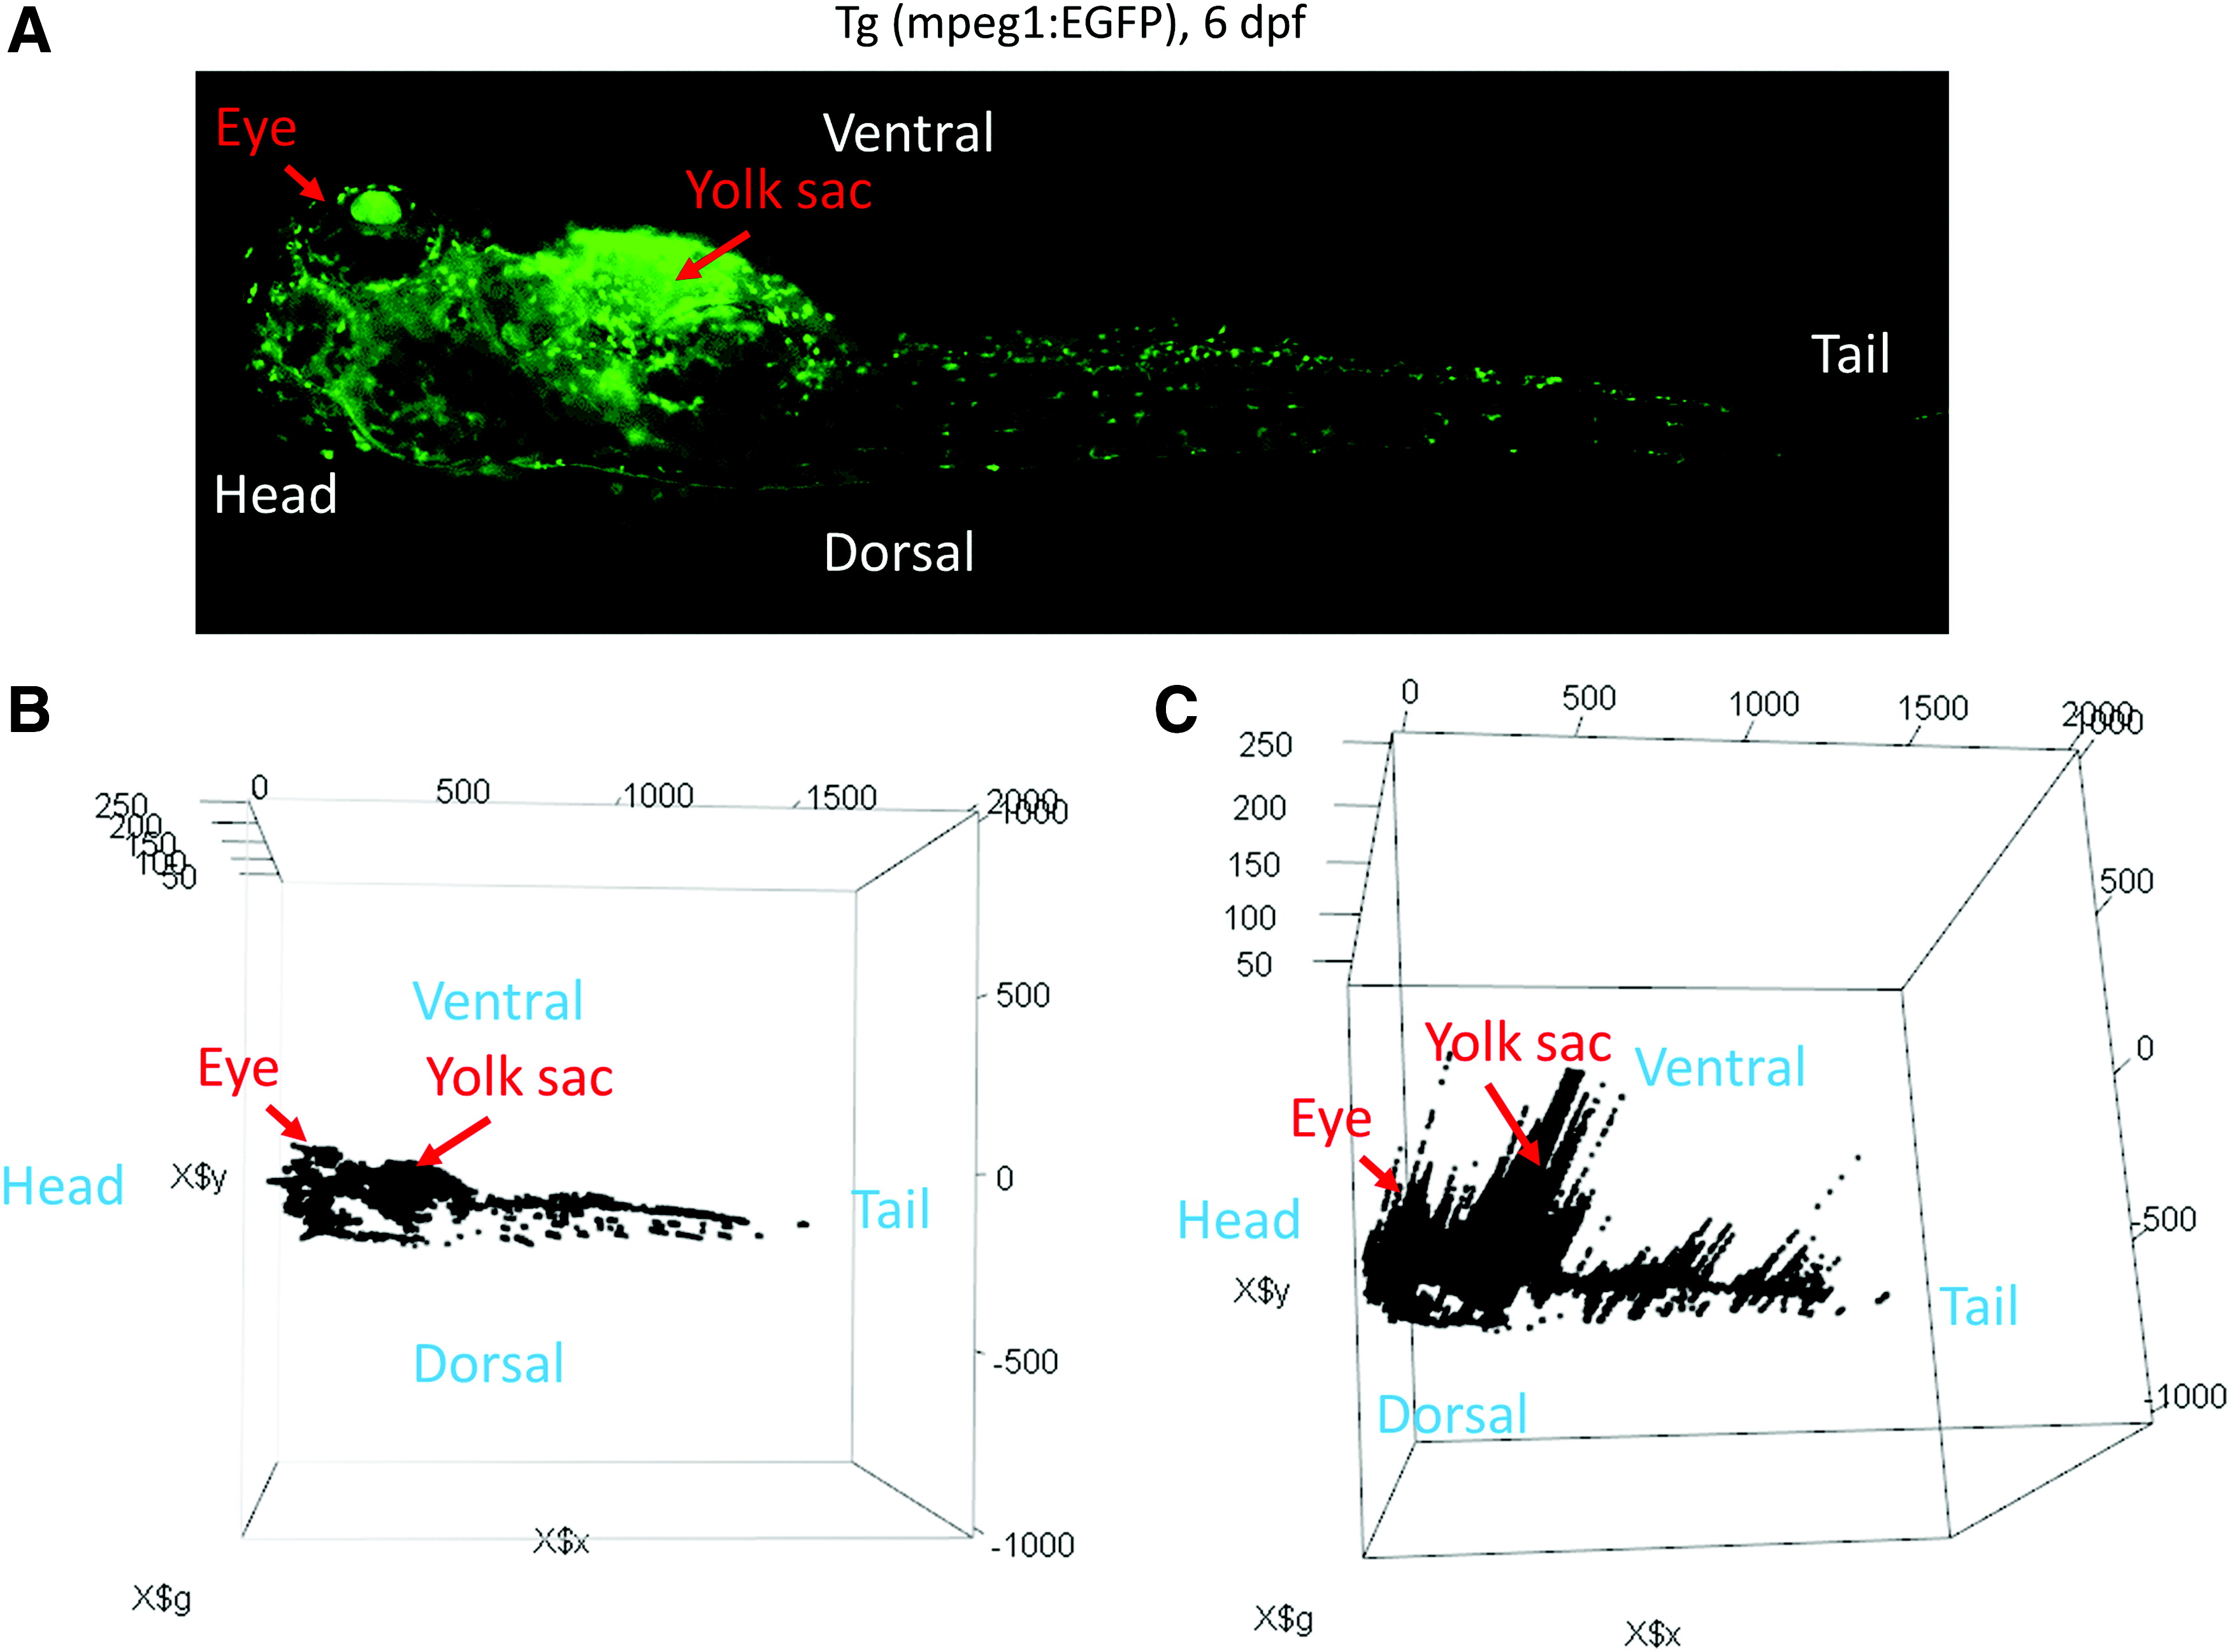
Fig. 4
Construction of a 3D fluorescence intensity model from the ZF-Mapper data. (A) Input image of macrophage-EGFP zebrafish (tg [mepg1:EGFP], 6 days postfertilization). (B) The ZF-Mapper output data were imported to the “rgl” package of R and a 3D scatter plot was created. (C) Tilted image of (B). An interactive 3D model can be downloaded as Supplementary Data. 3D, three-dimensional. Color images are available online.
Acknowledgments
This image is the copyrighted work of the attributed author or publisher, and
ZFIN has permission only to display this image to its users.
Additional permissions should be obtained from the applicable author or publisher of the image.
Full text @ Zebrafish