
|
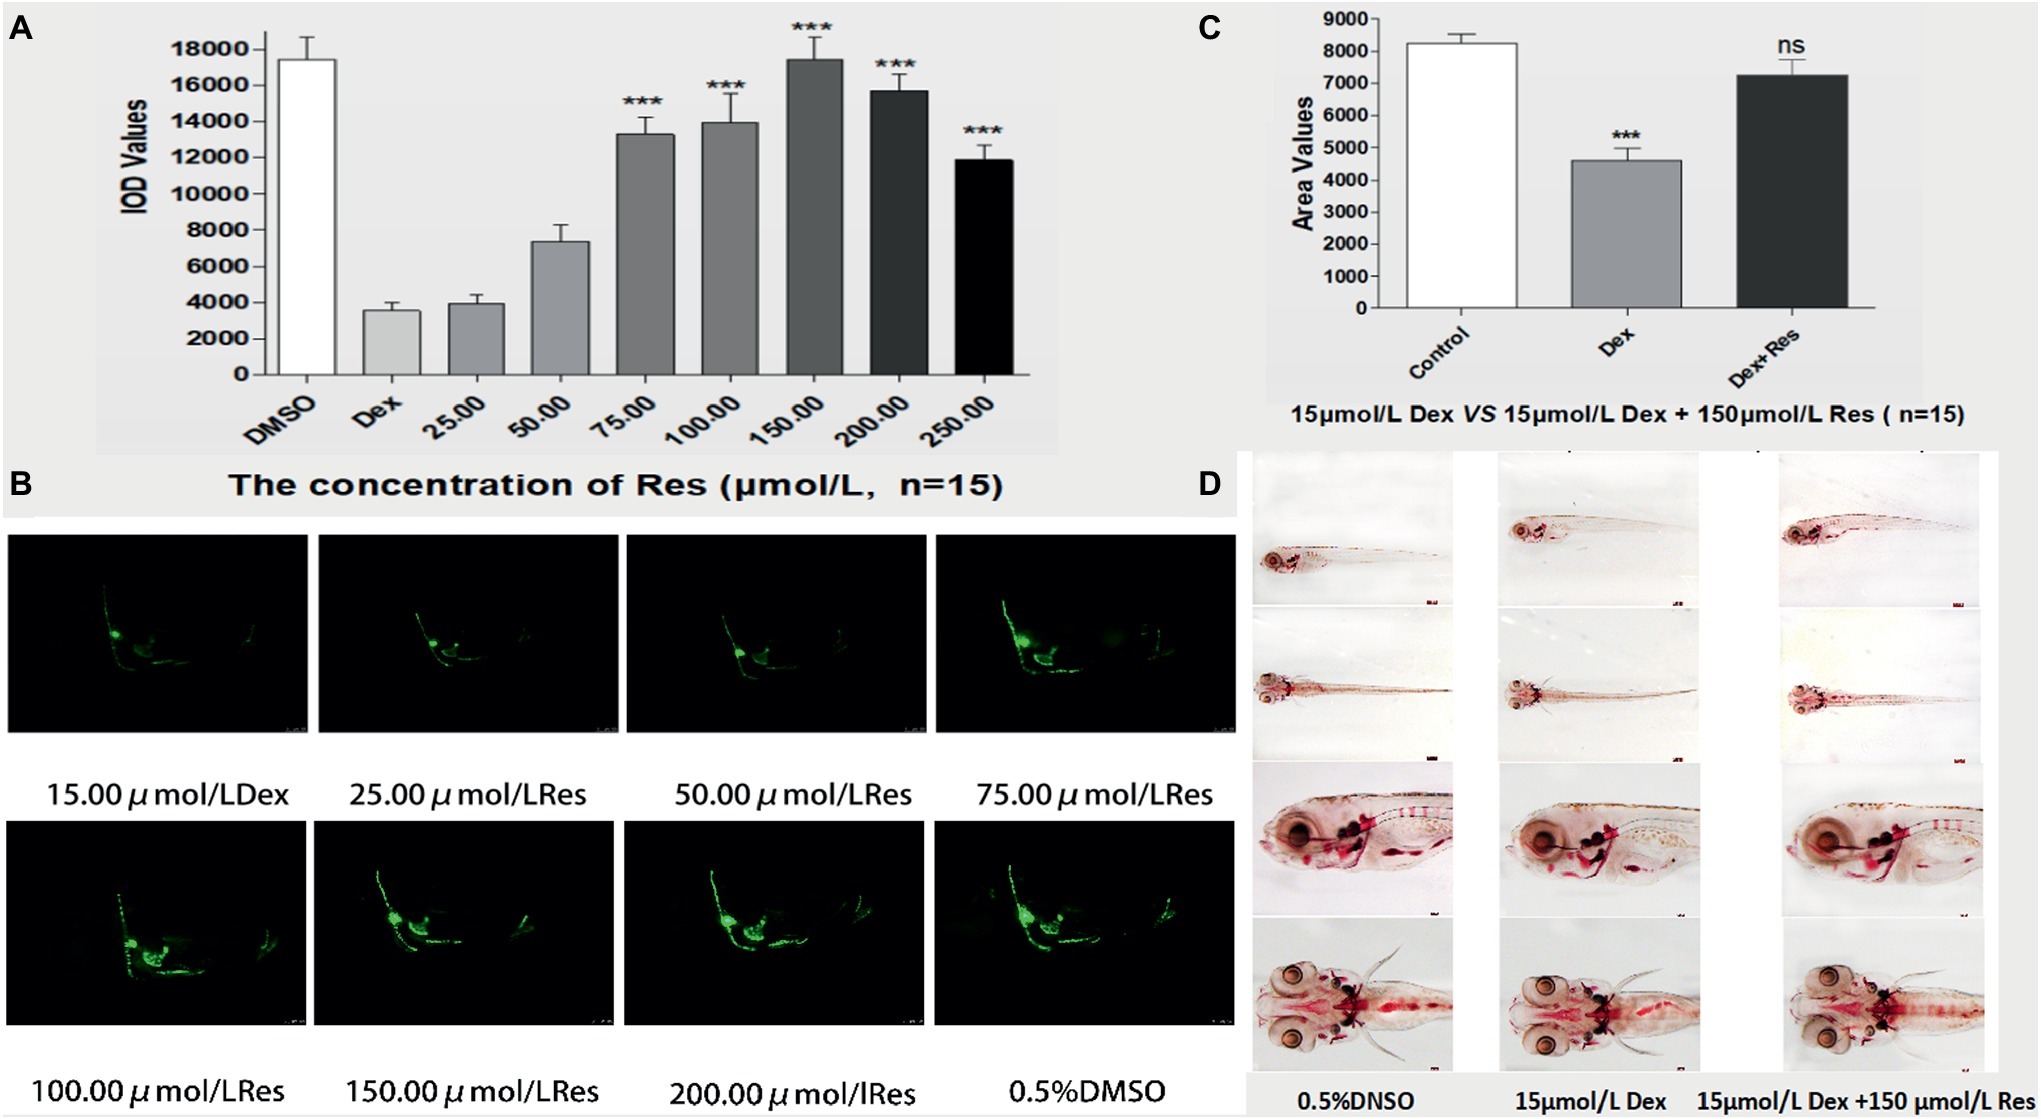
Fig. 3
Effect of Res on Dex-induced bone damage in zebrafish. IOD values of green fluorescence of Res after Dex-induced bone damage in TG zebrafish larvae (A). Images of green fluorescence in TG zebrafish larvae skull [in profile (B)]. The Res concentrations used were 25.00, 50.00, 75.00, 100.00, 150.00, 200.00, and 250.00 μmol/l, and 0.1% DMSO served as the control. The area of bone mineralization after Res treatment of Dex-induced bone damage in AB-strain zebrafish larvae at 9 dpf [(C) 15.00 μmol/l Dex vs. 15.00 μmol/l Dex plus 150.00 μmol/l Res]. Alizarin red S staining of the skull after Res treatment of Dex-induced bone damage in AB-strain zebrafish larvae at 9 dpf (D). n = 15, *p < 0.05, ***p < 0.01.