
Image
|
Figure Caption
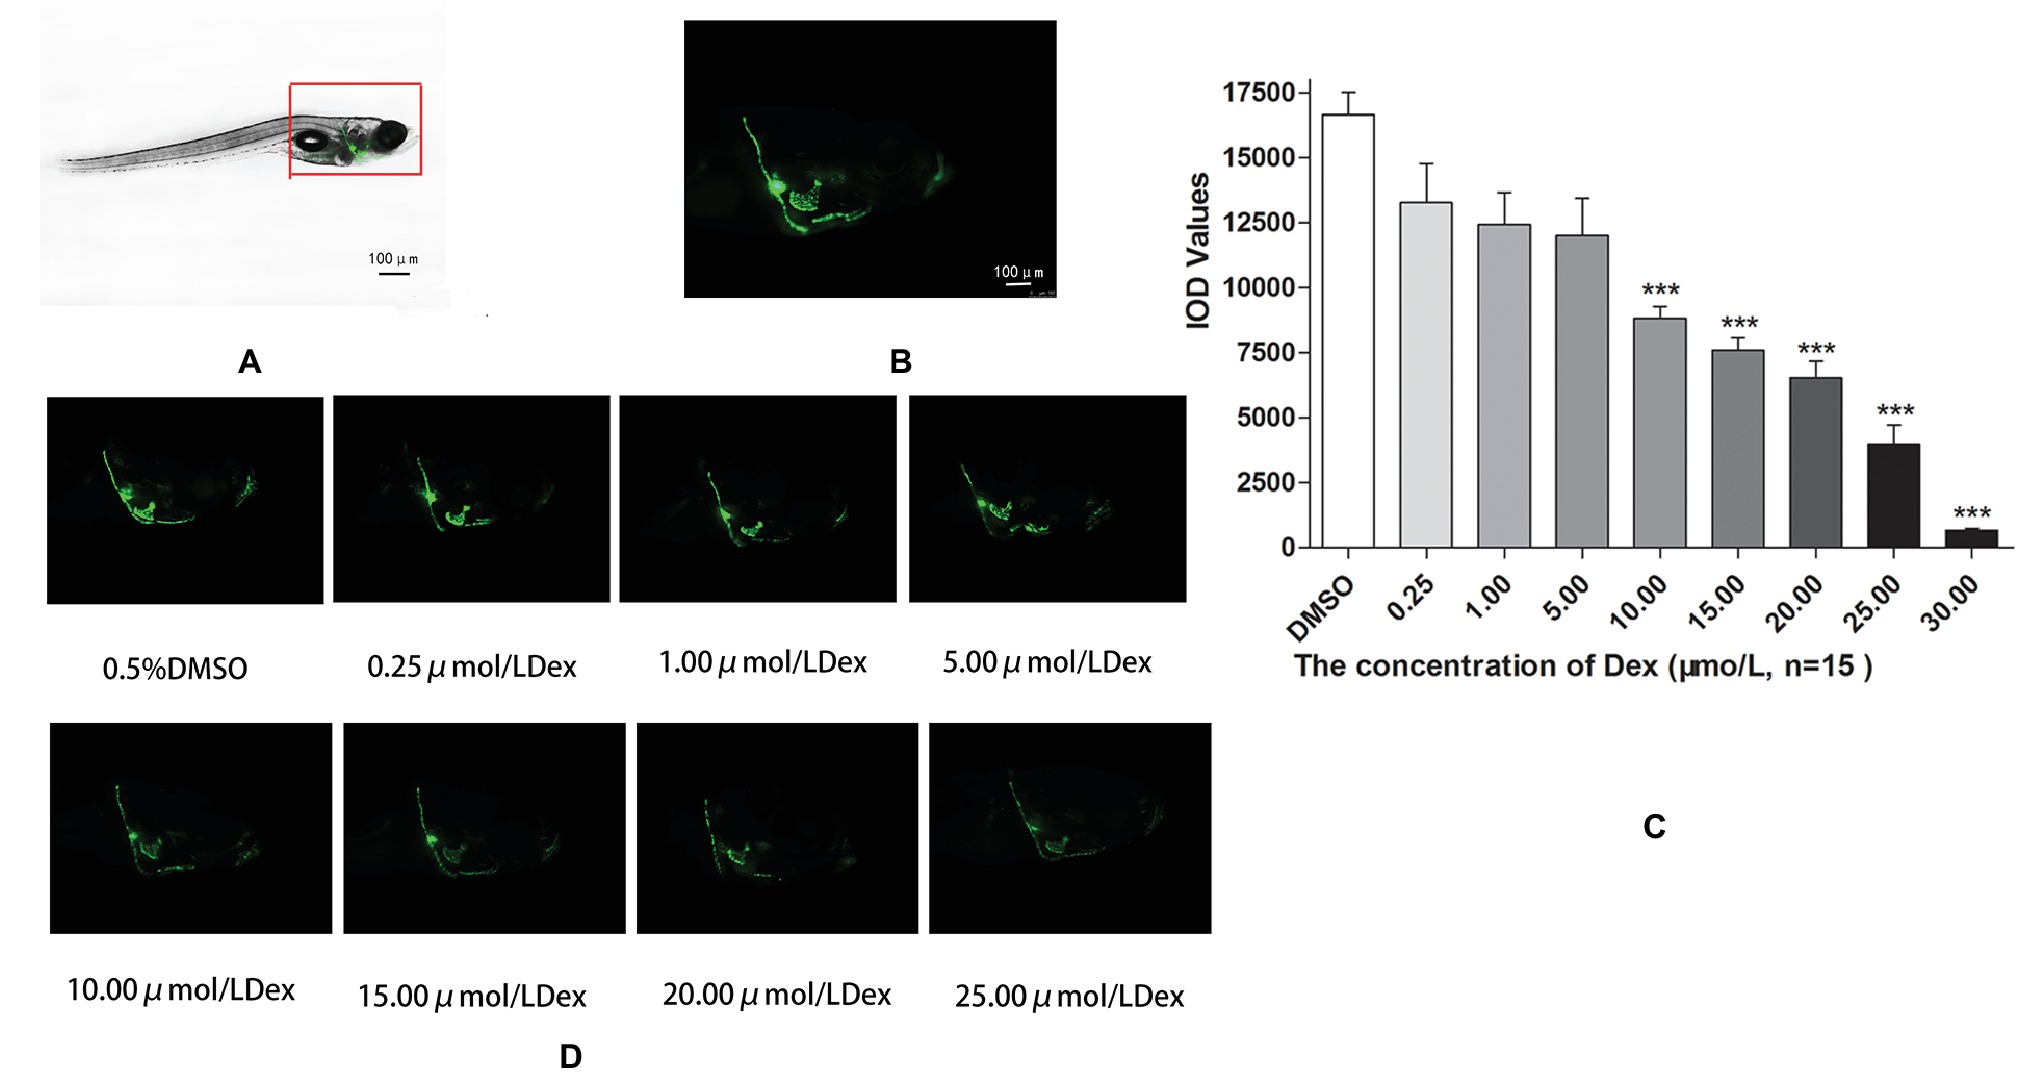
Fig. 1
Influence of dexamethasone (Dex) concentration on zebrafish skull. Schematic diagram of TG(SP7:EGFP) zebrafish larvae (A,B). IOD values of green fluorescence of Dex-induced bone damage in TG zebrafish larvae (C). Images of green fluorescence in TG zebrafish larvae skull [in profile (D)]. The Dex concentrations used were 0, 0.25, 5.00, 10.00, 15.00, 20.00, and 25.00 μmol/l, and 0.1% DMSO was used as the control. n = 15, ***p < 0.01.
Figure Data
Acknowledgments
This image is the copyrighted work of the attributed author or publisher, and
ZFIN has permission only to display this image to its users.
Additional permissions should be obtained from the applicable author or publisher of the image.
Full text @ Front Pharmacol