
Fig. 3.
- ID
- ZDB-IMAGE-190723-2566
- Genes
- Antibodies
- Publication
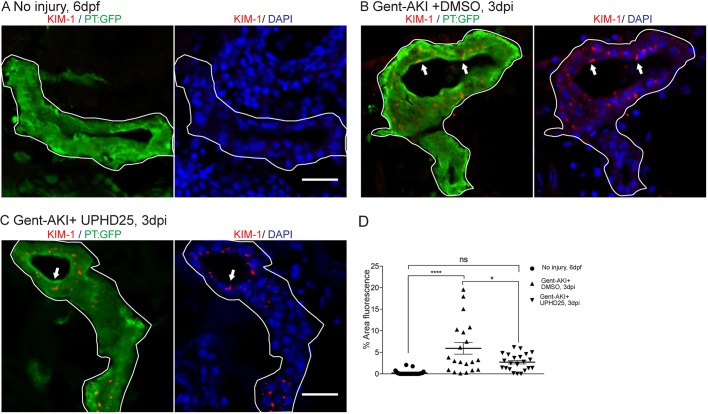
- Skvarca et al., 2019 - Enhancing acute kidney injury regeneration by promoting cellular dedifferentiation in zebrafish
- All Figures
- Figures for Skvarca et al., 2019
|
Fig. 3.