
IMAGE
Figure 2
- ID
- ZDB-IMAGE-190723-1819
- Genes
- Publication
- Klüver et al., 2011 - Transcriptional Response of Zebrafish Embryos Exposed to Neurotoxic Compounds Reveals a Muscle Activity Dependent hspb11 Expression
- All Figures
- Figures for Klüver et al., 2011
Image
|
Figure Caption
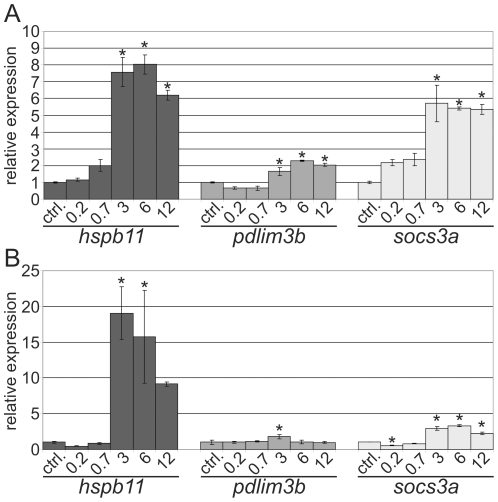
Figure 2
APM exposures for (A) 24 h (26–50 hpf) and (B) 2 h (48–50 hpf). Concentrations are given in µM. Bars represent the relative gene expression as fold change of the respective untreated control as mean ± standard deviation of three independent replicate exposures. Control = ctrl. * P<0.05.
Figure Data
Acknowledgments
This image is the copyrighted work of the attributed author or publisher, and
ZFIN has permission only to display this image to its users.
Additional permissions should be obtained from the applicable author or publisher of the image.
Full text @ PLoS One