
IMAGE
Fig. 6
- ID
- ZDB-IMAGE-190703-39
- Genes
- Publication
- Völkel et al., 2019 - Ezh1 arises from Ezh2 gene duplication but its function is not required for zebrafish development
- All Figures
- Figures for Völkel et al., 2019
Image
|
Figure Caption
Fig. 6
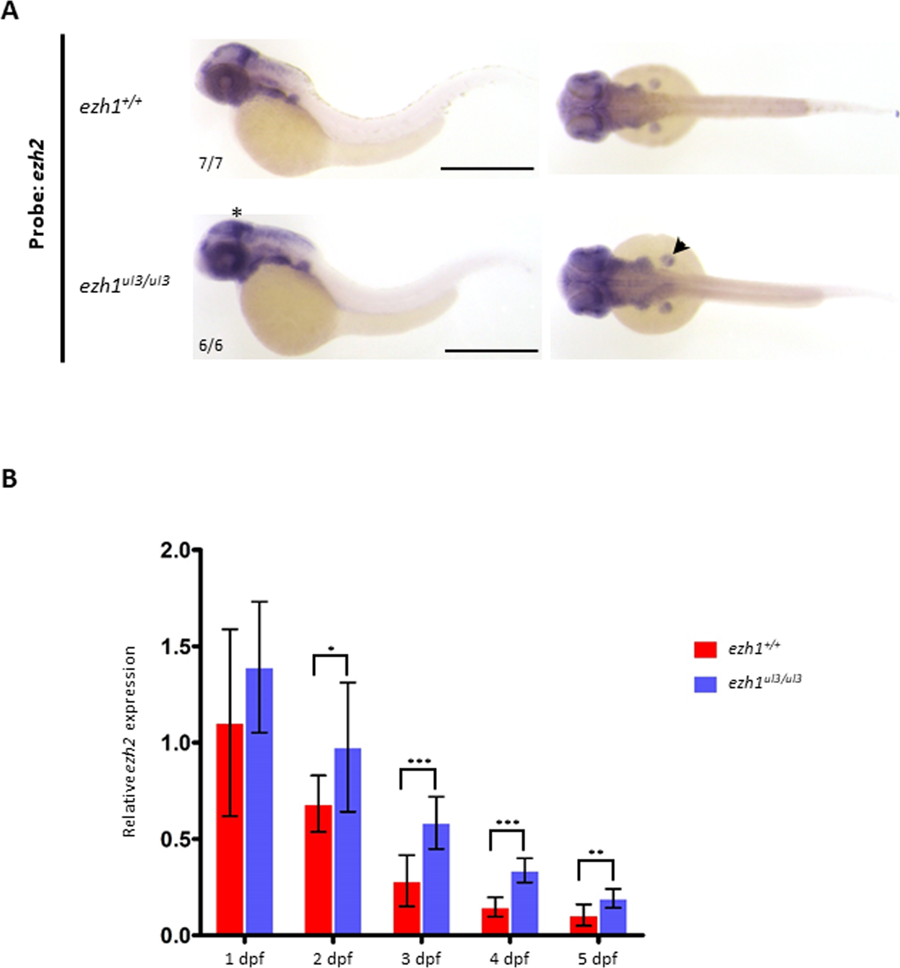
Loss of ezh1 function leads to an increase in ezh2 expression. (A) In situ hybridization showing ezh2 expression in representative embryos at 48 hpf from wild-type (Top) and ezh1ul3/ul3 crosses. A slight increase in the ezh2 signal at both sides of the midbrain-hindbrain boundary (asterisk) and in the pectoral fin buds (arrowhead) of MZezh1ul3/ul3 embryos is observed. Scale bar is 500 μm. The numbers indicate the number of embryos with the displayed compared to the total number of embryos analyzed. (B) Expression analysis of ezh1 in wild-type and MZezh1ul3/ul3 embryos and larvae at 1, 2, 3, 4 and 5 dpf quantified by RT-qPCR show an increase of ezh2 expression in MZezh1ul3/ul3 mutants. Three independent experiments were performed and statistical analysis was conducted using Student’s t-test. *P < 0.05; **P < 0.01; ***P < 0.001.
Figure Data
Acknowledgments
This image is the copyrighted work of the attributed author or publisher, and
ZFIN has permission only to display this image to its users.
Additional permissions should be obtained from the applicable author or publisher of the image.
Full text @ Sci. Rep.