
|
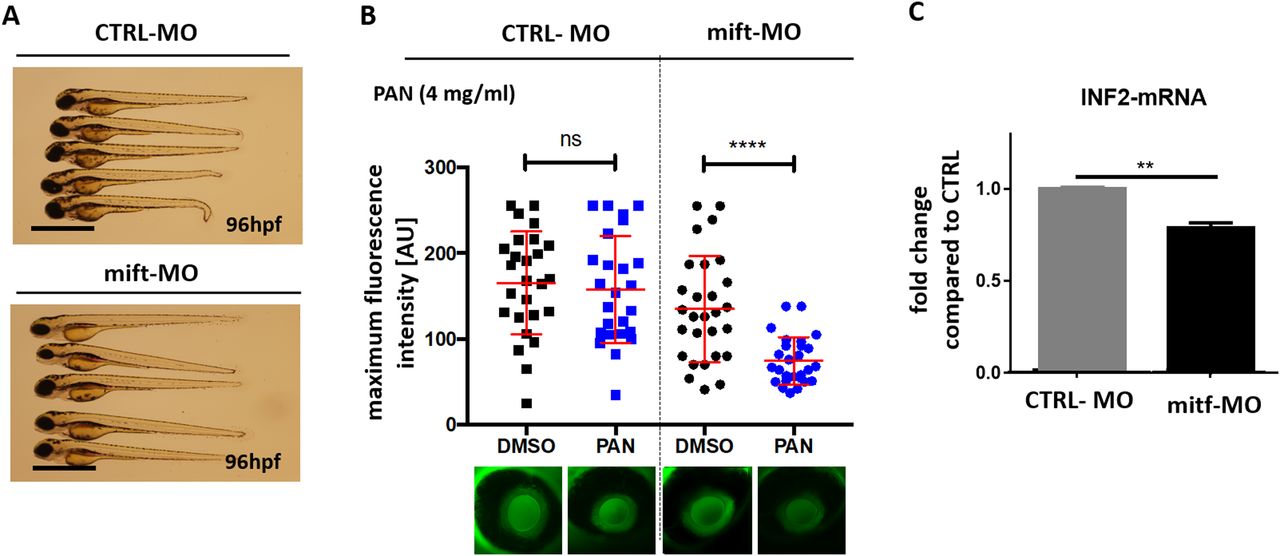
Fig. 4
Mitf knockdown model and PAN treatment. (A) Phenotype pictures of Tg(l-fabp:eGFP-DBP) zebrafish backcrossed on AB background that were injected with either a mitf MO or a scrambled MO in a concentration of 250 µM in one to four-cell stage. Pictures were taken at 96 hpf. (B) Tg(l-fabp:eGFP-DBP) zebrafish backcrossed on AB background were injected with a mitf MO or a scrambled MO in a concentration of 250 µM in one to four-cell stage. At 46 hpf fish were treated either with PAN (4 mg/ml) or DMSO. Intensity of circulating eGFP-DBP (arbitrary units) in the retinal vessel plexus of the fish eye was measured at 96 hpf. Representative images of the fluorescence of circulating eGFP-DBP in the retinal vessel plexus of the fish eye 96 hpf are shown at the bottom. n=25–28 per group. (C) Q-PCR for inf2 mRNA expression in whole zebrafish at 120 hpf. Zebrafish (AB strain) were injected with CTRL-MO or a mitf-MO at one to four-cell stage. Data from three different experiments. Significance was tested with two-way ANOVA: **P<0.01, ****P<0.001, ns, non-significant. Scale bars: 500 µm.