
Image
|
Figure Caption
Fig. 5
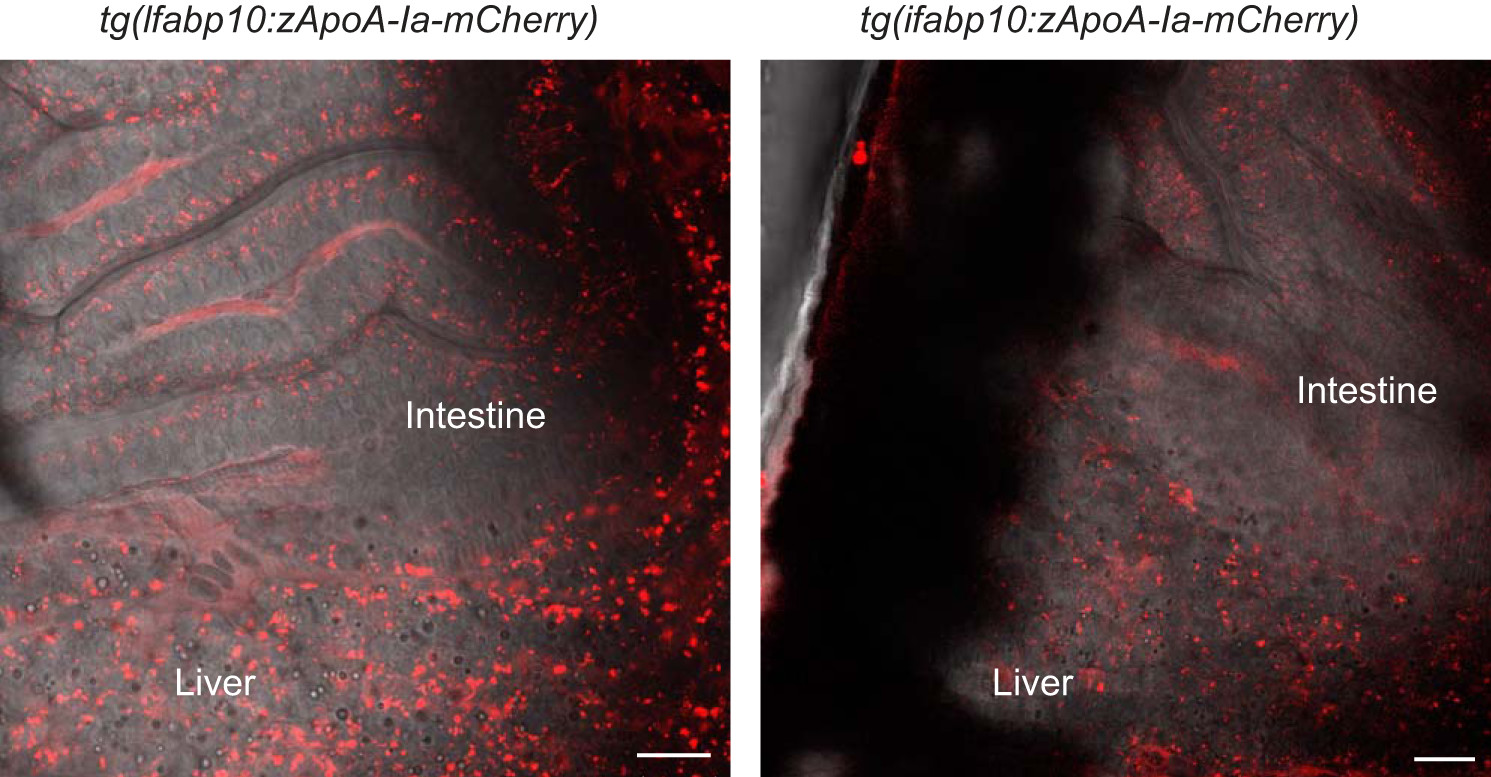
Transgenic zebrafish allows for visualization of zebrafish APOA-Ia in vivo. Live tg(lfabp10:zApoA-Ia-mCherry) (left) and tg(ifabp:zApoA-Ia-mCherry) larvae show APOA-I-mCherry accumulation in the liver and intestine (right). Scale bar = 20 µm, all larvae 6-dpf. APOA-I, apolipoprotein A-I; dpf, days postfertilization.
Acknowledgments
This image is the copyrighted work of the attributed author or publisher, and
ZFIN has permission only to display this image to its users.
Additional permissions should be obtained from the applicable author or publisher of the image.
Full text @ Am. J. Physiol. Gastrointest. Liver Physiol.