
IMAGE
Fig. 7-S1
- ID
- ZDB-IMAGE-190618-37
- Publication
- Lush et al., 2019 - scRNA-Seq reveals distinct stem cell populations that drive hair cell regeneration after loss of Fgf and Notch signaling
- All Figures
- Figures for Lush et al., 2019
Image
|
Figure Caption
Fig. 7-S1
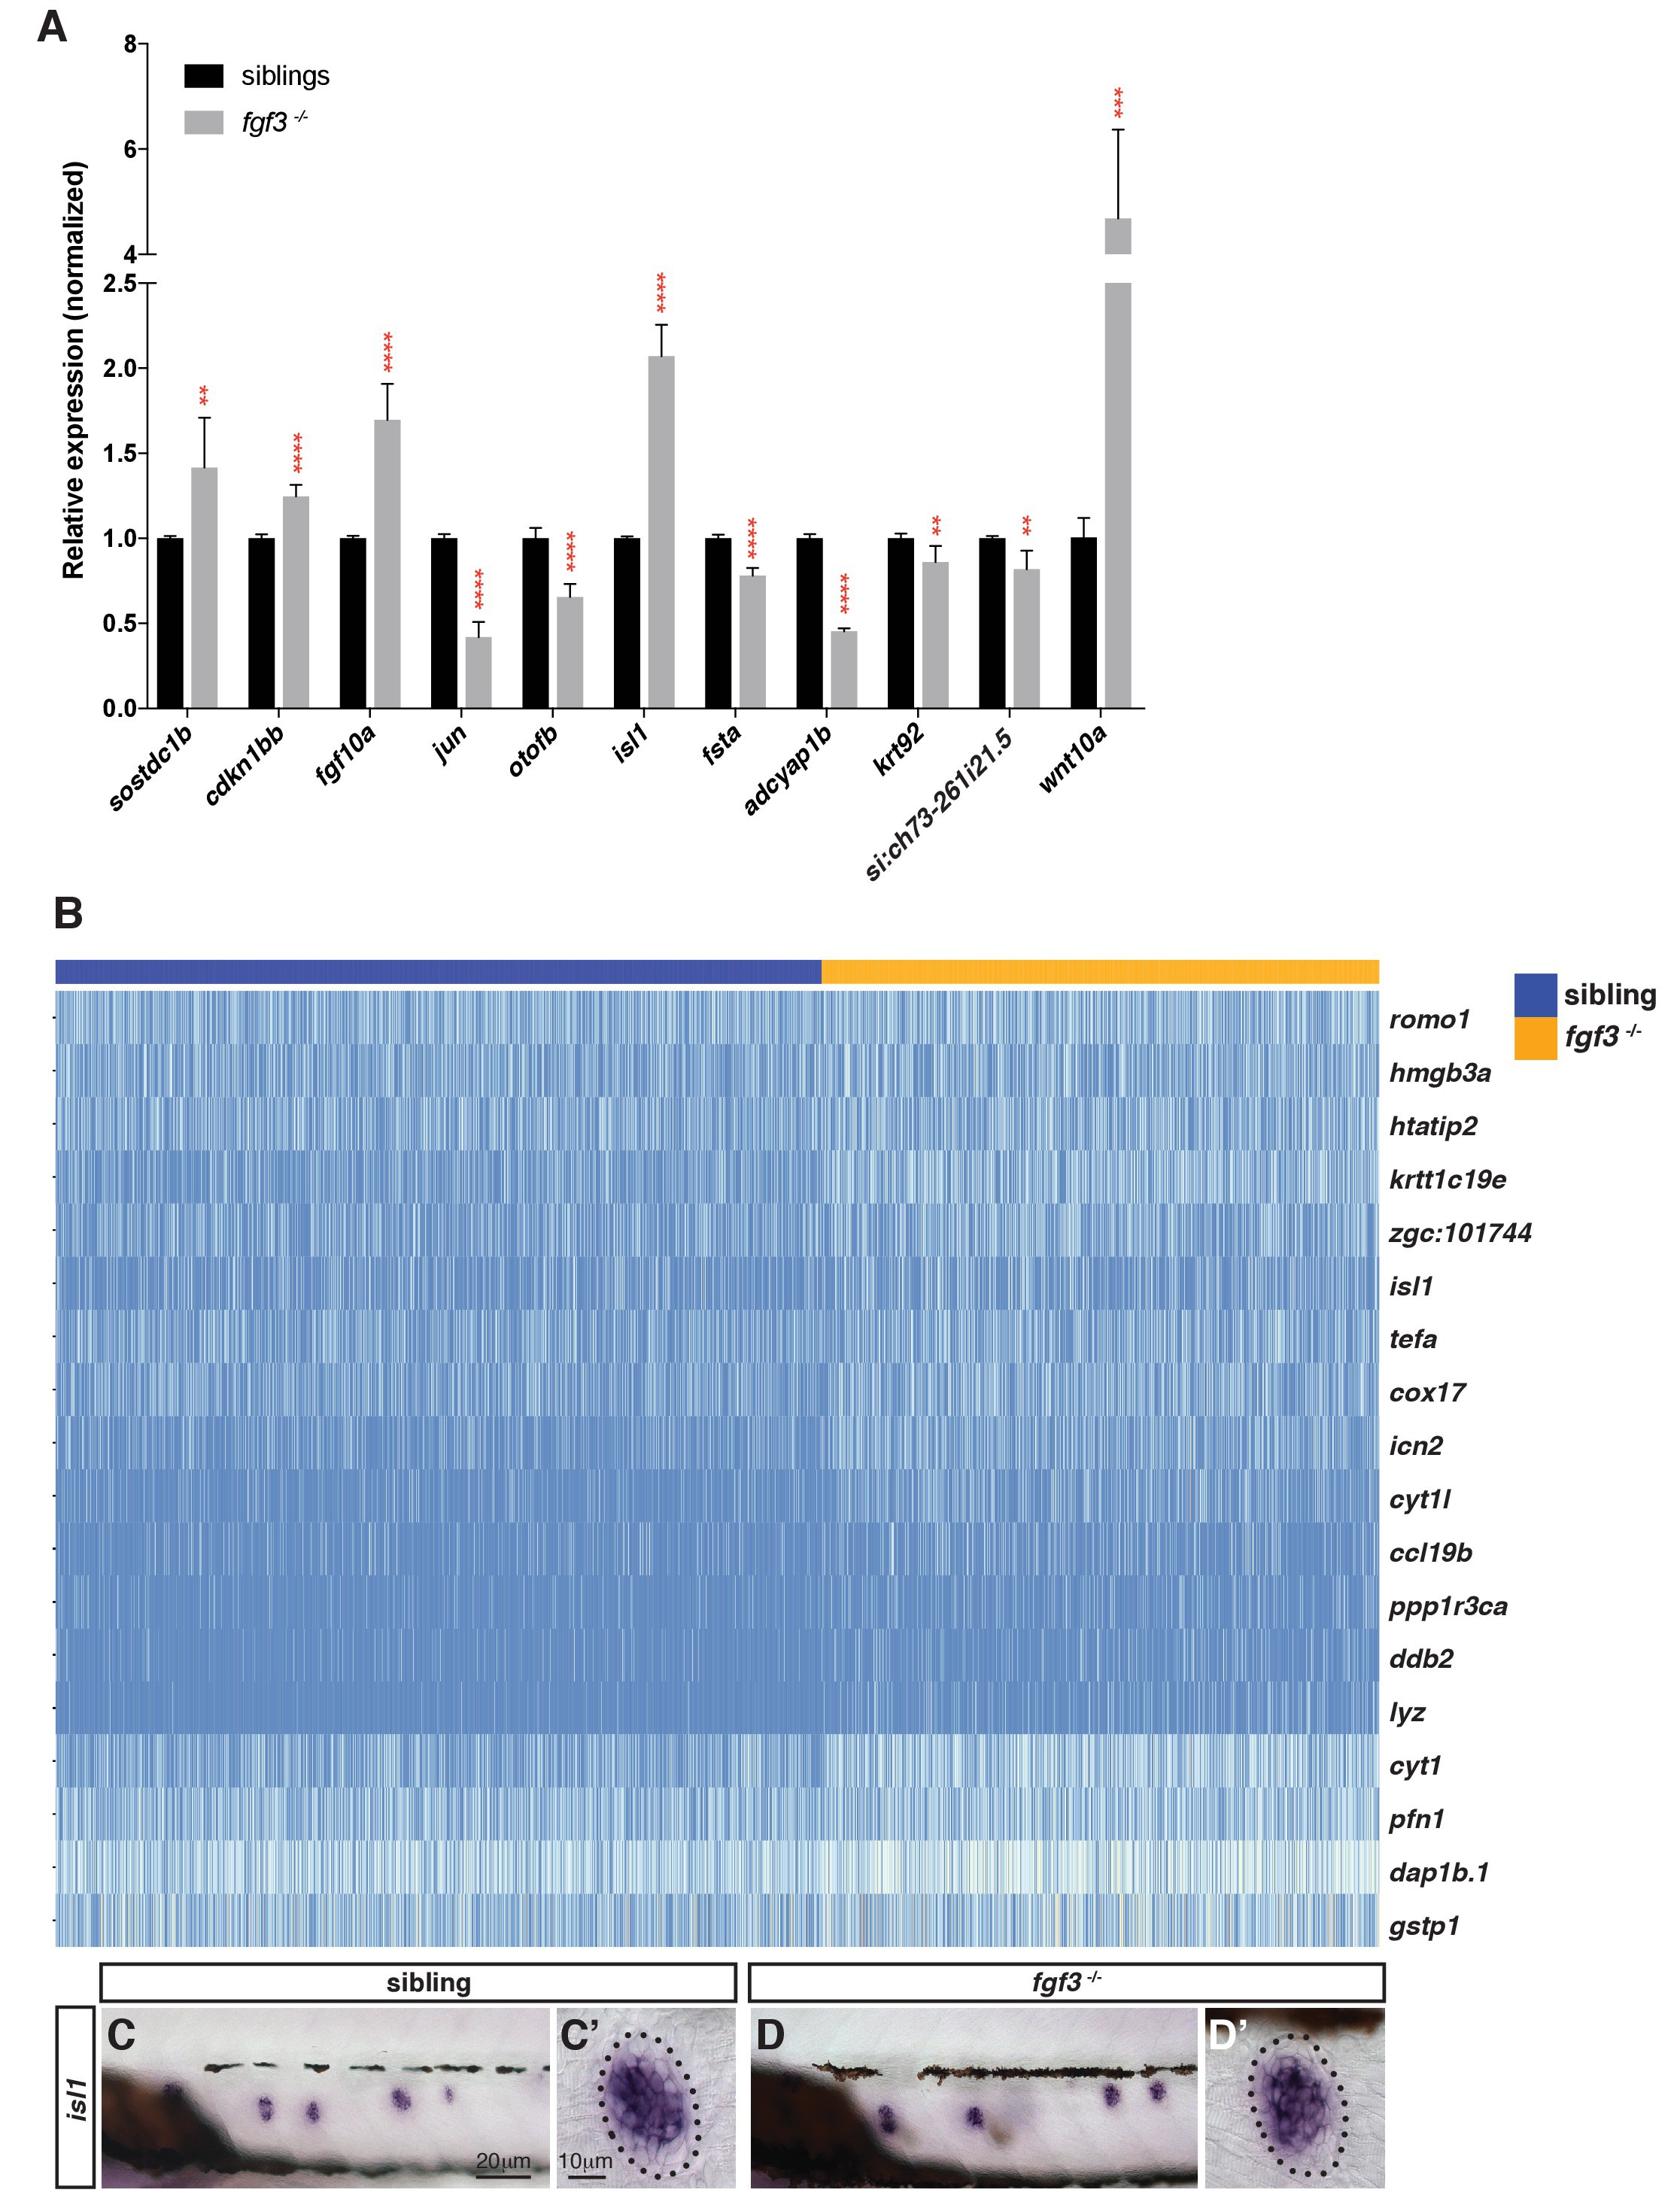
Selection of genes that are differentially expressed in fgf3 mutants.
(A) RT-qPCR with candidate genes identified in the fgf3-/- scRNA-Seq analysis. Error bar: SD, t-test, **p<0.01, ***p<0.001, and ****p<0.0001. (B) Heatmap of genes upregulated in fgf3 mutant lateral line cells. (C–D’) In situ hybridization of isl1 that is slightly upregulated in fgf3-/-neuromasts.
Acknowledgments
This image is the copyrighted work of the attributed author or publisher, and
ZFIN has permission only to display this image to its users.
Additional permissions should be obtained from the applicable author or publisher of the image.
Full text @ Elife